Lesson 11 | How to Read Price and Volume Together
When I started learning charts, I kept hearing the same advice: "just follow price action." It never quite worked, and here's why, price alone only tells you half the story.
PVSRA stands for Price, Volume, Support & Resistance Analysis. It's a method for reading what the biggest participants in the market are actually doing, using three pieces of information that are on every chart: price, volume, and key levels. No secret indicator, no paid signal. Let me walk you through it.
If you need to still find and install this indicator for TradingView, I add and use it in this video (if you've already got it, just scroll down for the rest of the tutorial).
1. Markets are moved by market makers
Markets aren't random. The largest participants - market makers and institutional money - have enough size to move price, and they use that ability deliberately: they push price toward levels where they can fill large orders, and away from levels where they can't.
We can't compete with their size. What we can do is track their activity, because size can't hide. Every large order shows up in one place: volume.
That's the whole premise of PVSRA - volume reveals what price alone conceals.
2. Read price and volume together
A candle shows you what price did. Volume shows how much business was done in real time. The two combined tell you whether a move is real:
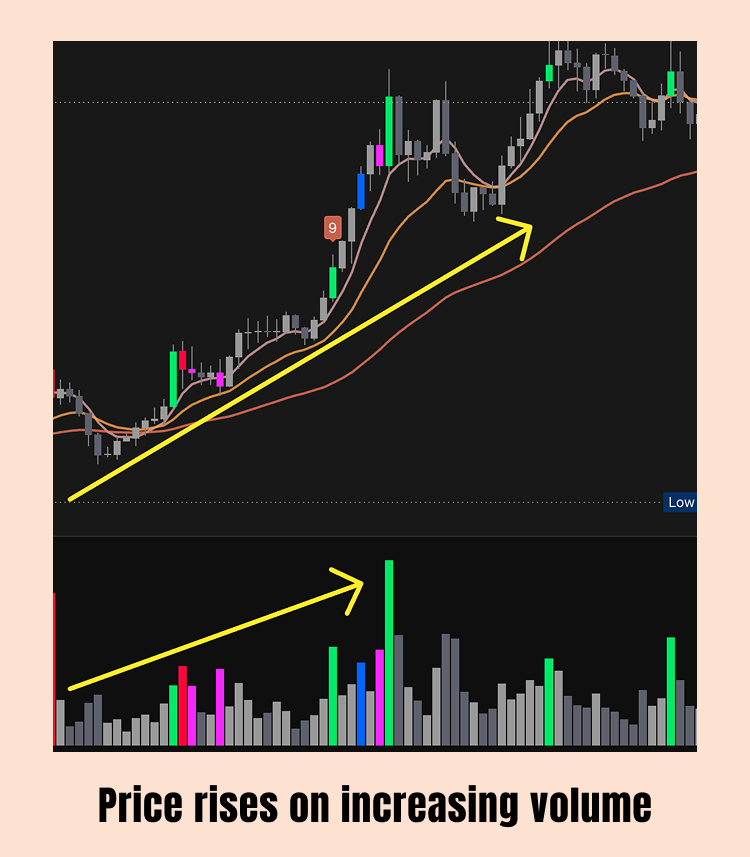
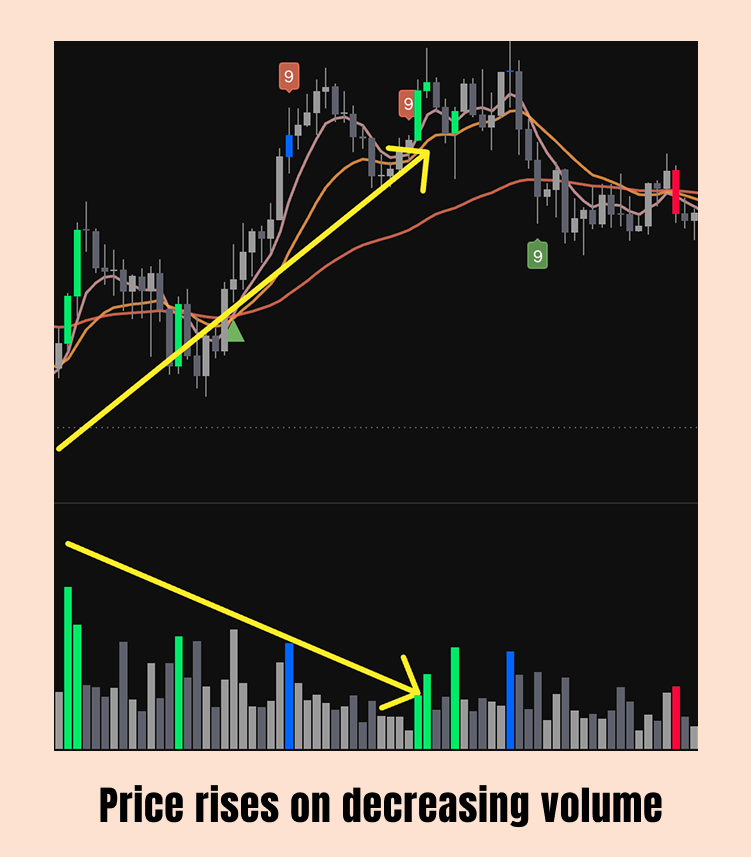
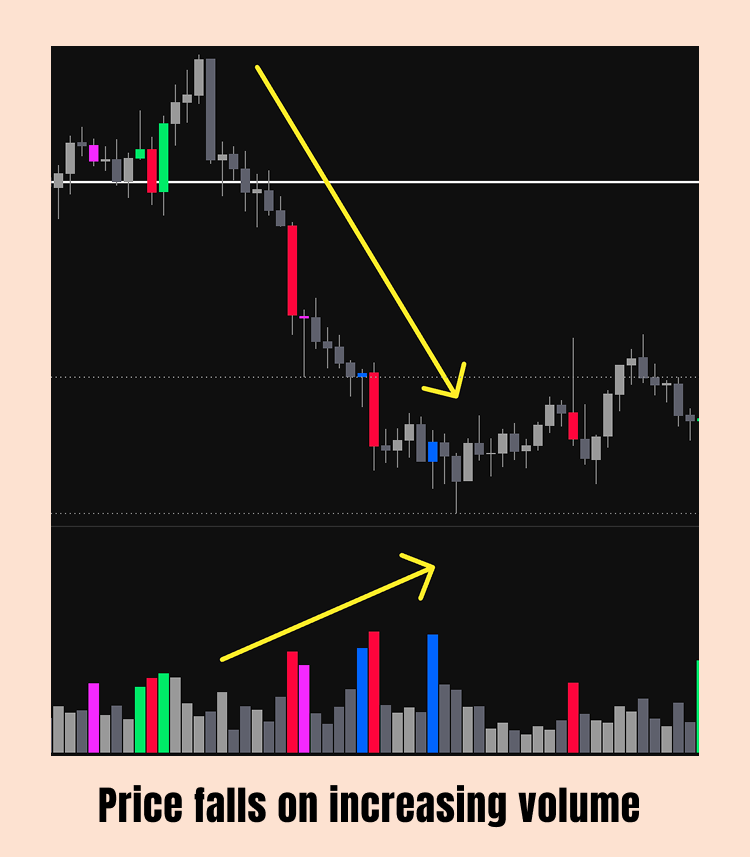
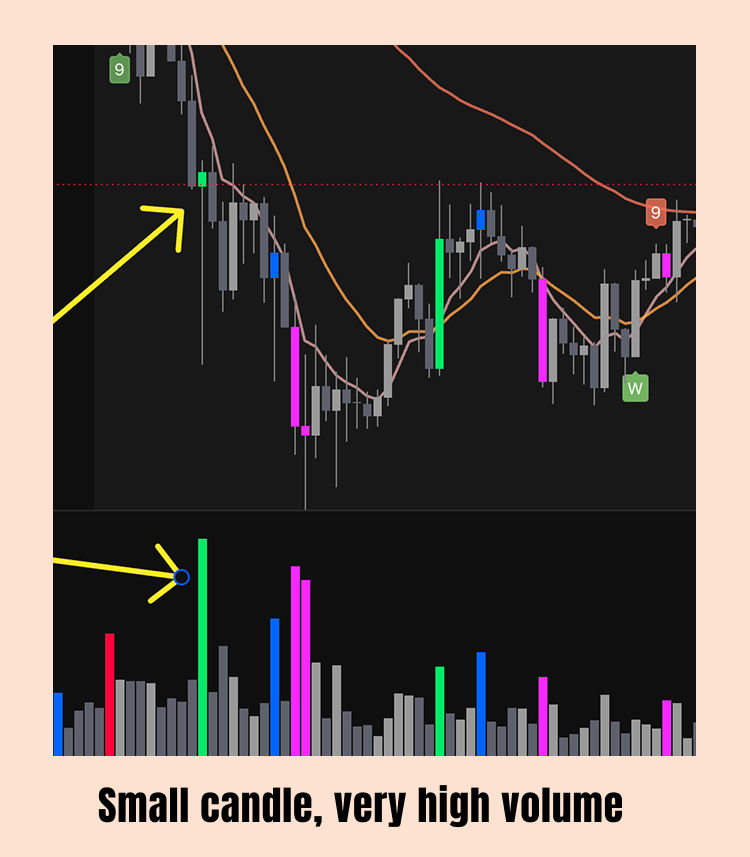
Mom Tip: Volume is the honesty check. Before trusting any move, ask one question: is volume confirming it, or contradicting it?
3. The candle colour system
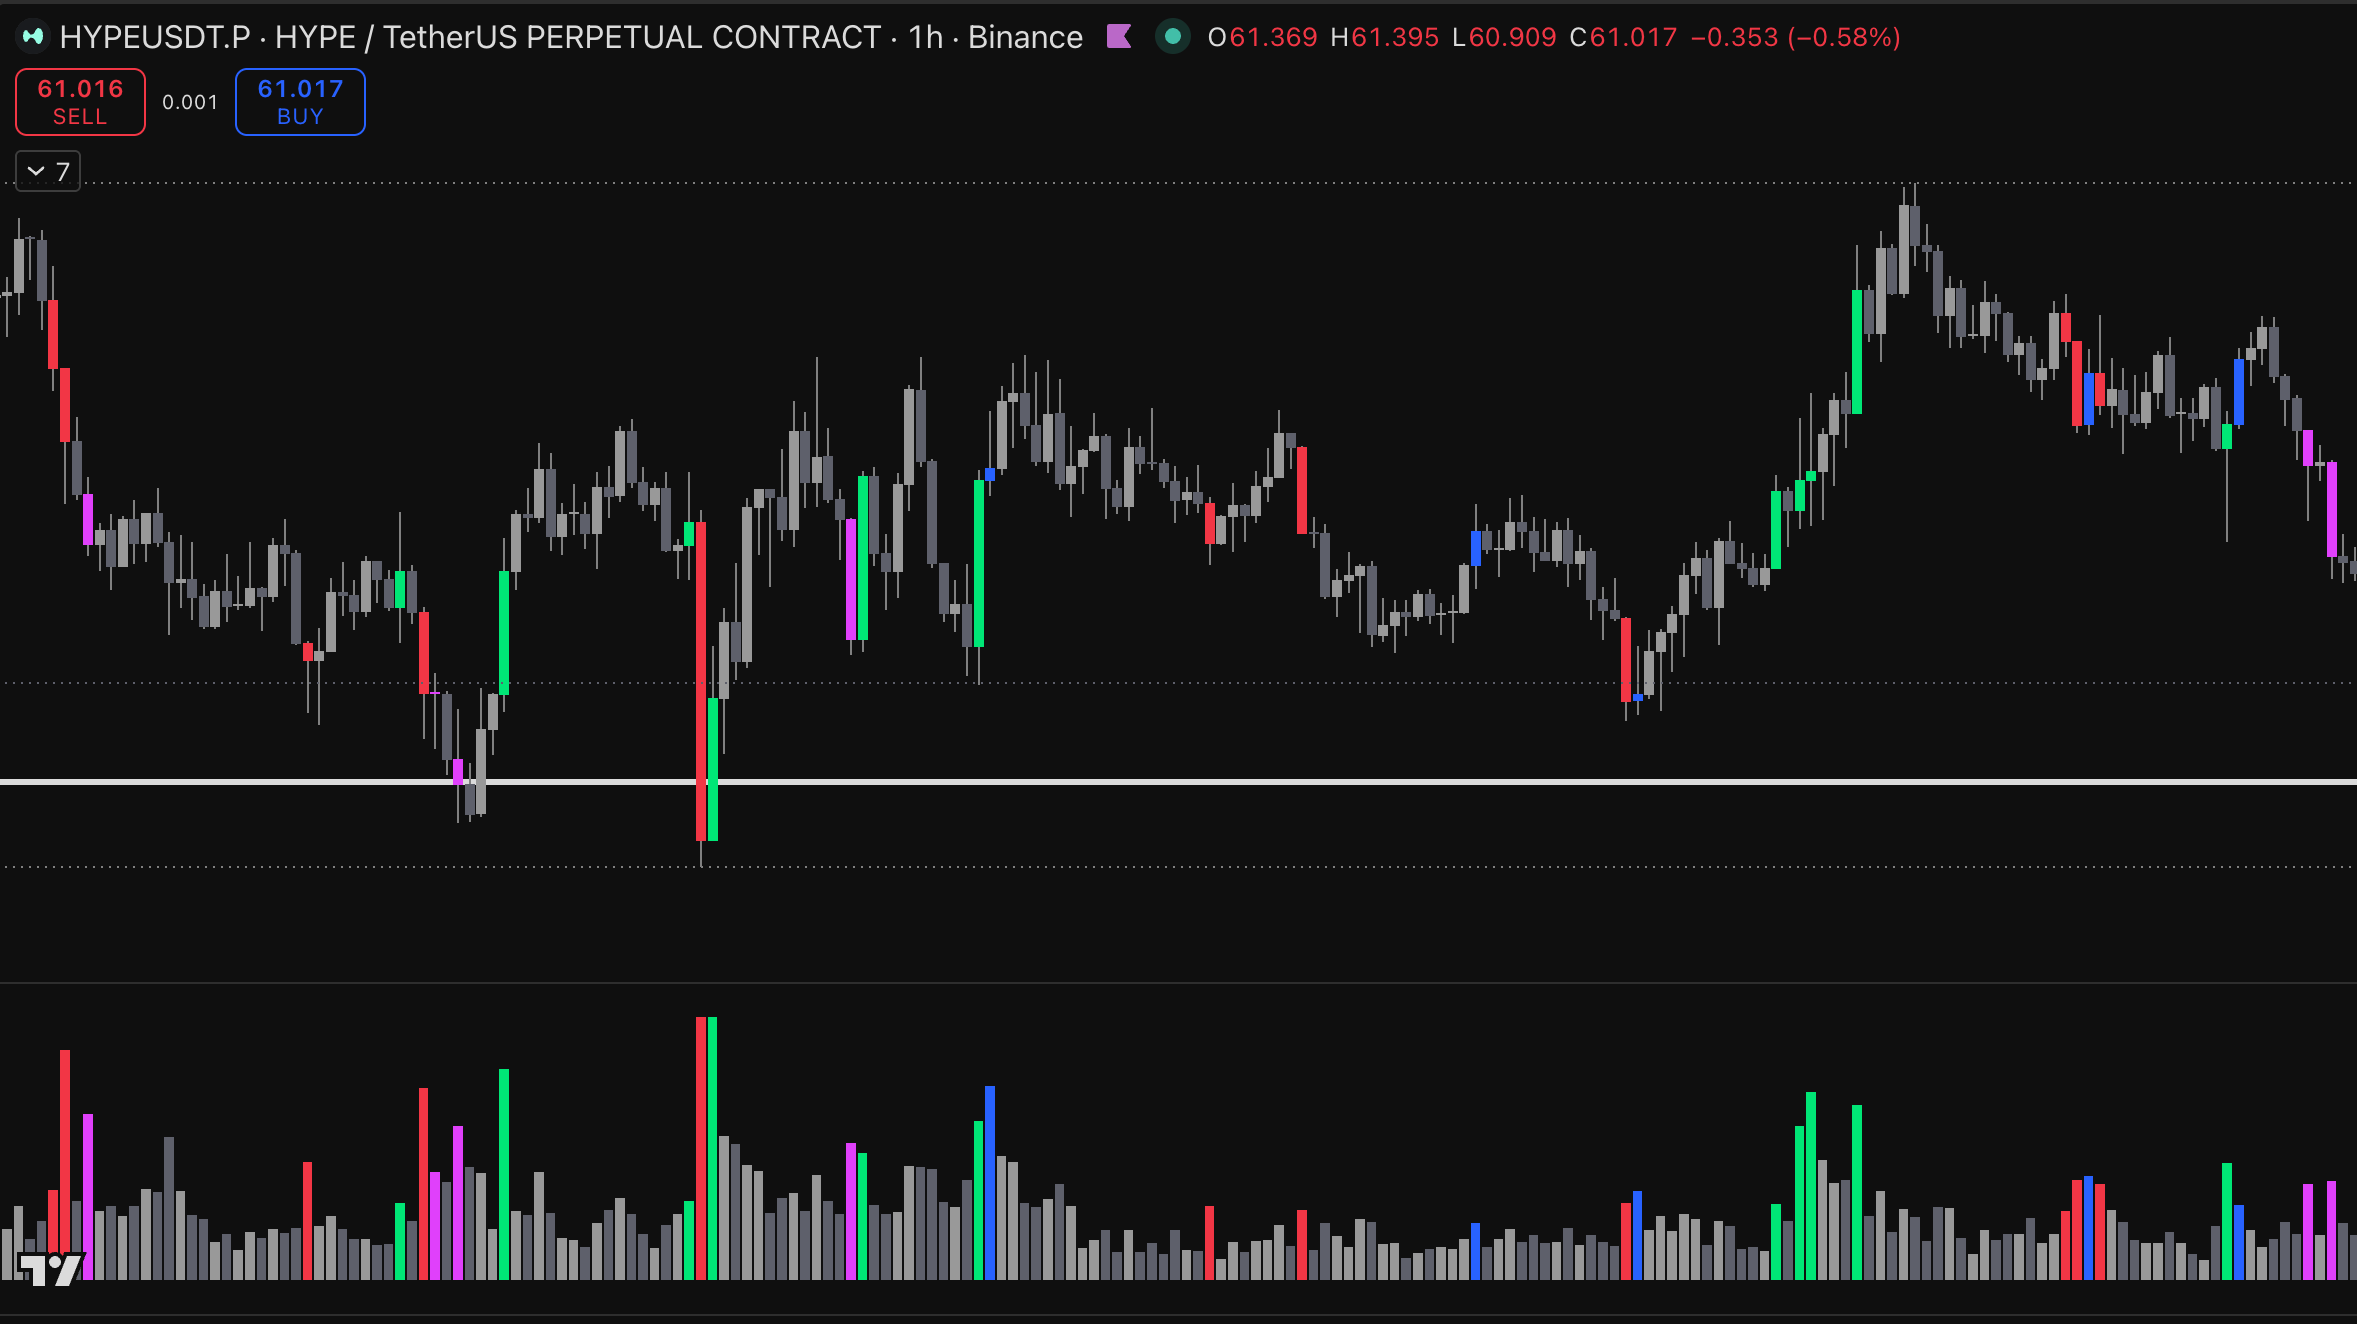
The PVSRA indicator does the volume maths for you. It compares each new candle to the 10 candles before it and colours it accordingly, so you can read activity at a glance instead of studying the volume bars:
- Grey (light for up, dark for down) - normal volume, below 150% of the last 10 candles' average. Nothing unusual, and this is most candles.
- Blue (up) / violet (down) - rising volume, 150% or more of that 10-candle average. Interest is picking up.
- Green (up) / red (down) - climax volume: 200% or more of the 10-candle average, or where the candle's size × volume is the highest of the last 10. This marks extreme activity.
A climax candle means the big players just did serious business. The critical question is always where it printed:
- Climax volume appearing repeatedly at highs → likely distribution (selling into strength). Bearish signal.
- Climax volume appearing repeatedly at lows → likely accumulation (buying into weakness). Bullish signal.
Volume spikes at support and resistance: what's really happening?
Yes, your instinct is right. Big players can't sell a huge position (or buy one) without a crowd to trade against. So they manufacture the crowd.
A volume spike above a resistance level → likely selling/shorting. To offload a large position, they need lots of eager buyers. So price is pushed up through resistance. It looks like a breakout, which pulls in buyers and triggers everyone's buy-stops, and that wave of buying is exactly the demand the big players sell into, from a higher price. The tell: a big volume spike just above the level, then price rejects straight back down.
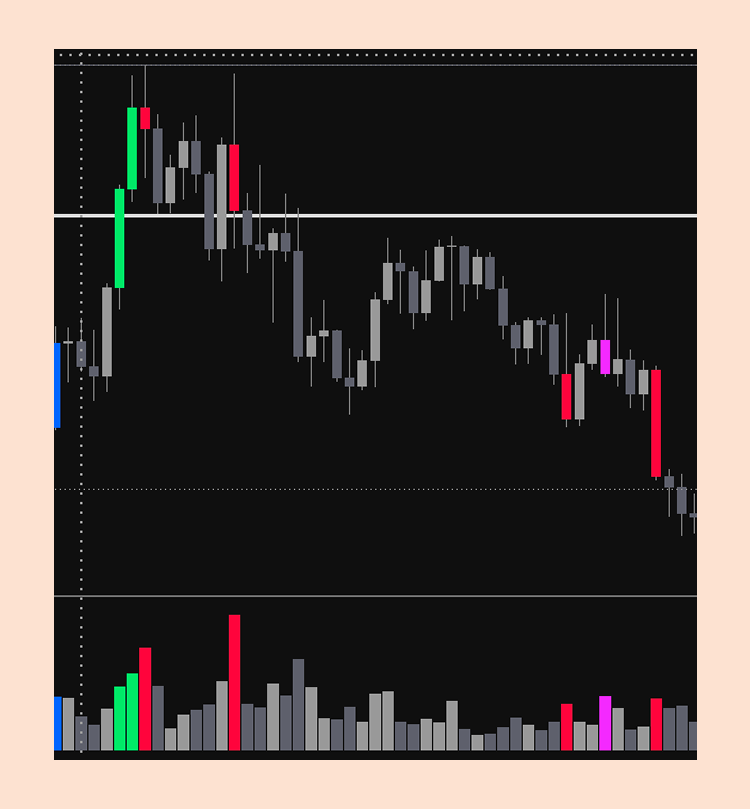
A volume spike below a support level → likely buying. Same trick in reverse. Price is pushed below support, which trips everyone's stop-losses and scares out sellers. All that panic selling is cheap supply, and the big players quietly buy it up. Then price snaps back up.
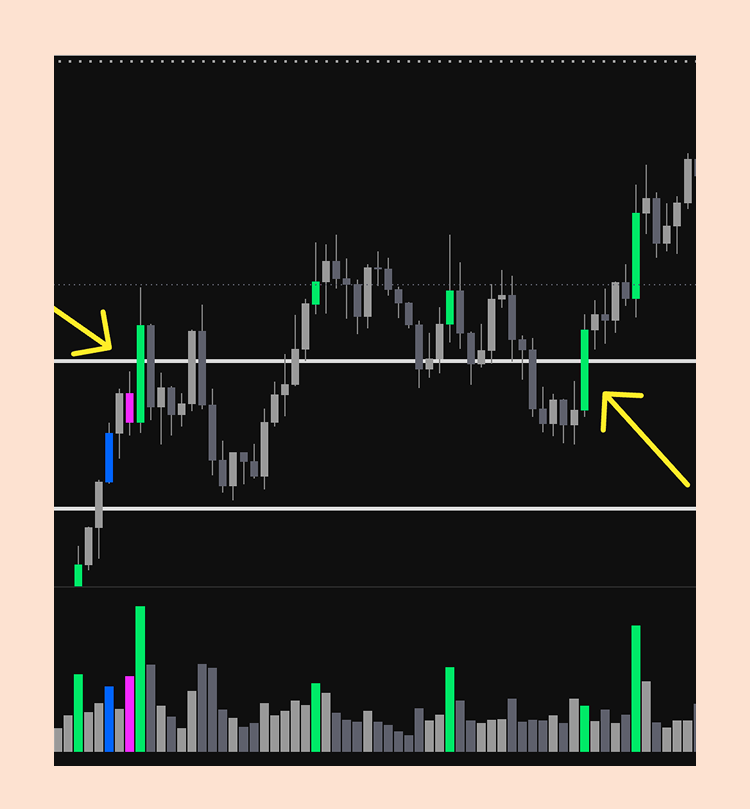
So the pattern to burn into your memory: big volume at a level, followed by a sharp reversal, is the footprint of large players filling their orders against the crowd. A real breakout keeps going; a fake one spikes, reverses, and traps everyone who chased it.
4. Support and resistance: the level hierarchy
Not all levels are equal. PVSRA ranks them in a clear order of importance:
- Whole numbers (e.g. 1.5000, or $100,000 on Bitcoin) - strongest
- Half numbers (1.5050)
- Quarter numbers (1.5025 / 1.5075)
- Historical price zones - areas where price has reversed or consolidated before
Market makers do their largest business at these levels because that's where orders cluster. A volume spike at a whole number carries far more weight than the same spike in the middle of nowhere. When you're marking up a chart, start with the whole numbers and work down the list.
5. The four market phases
Price moves through the same cycle, repeatedly, on every timeframe:
- Accumulation - big players build long positions while price ranges sideways. Looks boring and directionless by design.
- Markup - the sustained move up, after positions are built.
- Distribution - big players sell their positions back to late buyers. Sideways again, often near highs.
- Markdown - the sustained move down. Then the cycle restarts.
Two practical rules follow from this:
- A range with repeated volume spikes is usually a position-building phase - accumulation or distribution. Don't guess the breakout direction; the volume clues above tell you which side is loading up.
- Enter after a phase completes and the direction confirms, not during the sideways phase. Trading inside the range is the advanced game. Waiting for the resolution is the high-probability one.
Mom Tip: The boring sideways sections are where the real decisions get made. The big moves are just the results.
6. Context changes everything
The same candle can mean two completely different things in two different places. A red climax candle at the top of an extended rally is a warning of distribution. The identical candle in the middle of a range is mostly noise.
So before reacting to any candle, check four things: its size relative to its volume, its shape (pin bars and rejection wicks carry their own message), its zone (is it at a whole number, a support level, a prior high?), and the reaction (what did the next few candles do - follow through, or stall?).
Signal + location + follow-through. Never signal alone.
7. The timeframe process
Work top-down, always in this order. Each chart has a specific job:
- Daily - draw in your key support and resistance levels, and put a Fib on the last big wave. This is your big-picture map.
- 4-hour - draw a second Fib on the last wave at this zoom, and add your trend line. Now you can see the shorter-term pullback levels and the direction the market is leaning.
- 1-hour - confirm the trend and structure. Is price still respecting the trend line and making sense against your levels? This is your sanity check before you commit.
- 15-minute to 1-hour - time the entry.We never go below the 15-minute chart. Lower timeframes add noise, not information, and they pull you into overtrading.
And the golden rule stands: wait. Let the phase complete, let the level be tested, let volume confirm. We don't chase green candles, we wait for the market to come to us.
Mom Tip: The original PVSRA traders scale in with tiny orders, a tenth of normal size - because they trade without a fixed stop loss. That's not how we do it. We keep position sizes small, know exactly where we're wrong before we enter, and protect our capital first. Always.
This week's homework
Open TradingView, add the PVSRA indicator, pull up Bitcoin on the 4-hour chart, and spend the week observing, no trading. Each time a green or red climax candle prints, log three things: where it happened (whole number? support? a high or low?), whether price confirmed or contradicted it, and what the next few candles did.
That's the entire skill: price, volume, level, reaction. Repetition builds the eye.
Come share what you spot in the Telegram group. I'll be doing the same from my end.
🤍 Mel
Frequently Asked
What is PVSRA in trading? PVSRA stands for Price, Volume, Support & Resistance Analysis. It's a method for reading what the biggest participants in the market are doing by combining three pieces of information already on every chart: price, volume, and key levels.
What does volume tell you about a price move? Volume is the honesty check on price. A move backed by high volume has real participation and is more likely to continue. A move on falling volume is weakening and vulnerable to reversal.
What is a climax candle in PVSRA? A climax candle is a candle where volume is 200% or more of the 10-candle average (or where candle size multiplied by volume is the highest of the last 10 candles). It marks extreme activity and often signals accumulation at lows or distribution at highs.
What is accumulation vs distribution? Accumulation is when big players quietly build long positions while price ranges sideways, often at lows. Distribution is when they sell those positions to late buyers, often at highs. Both look boring by design.
Why does big volume at support or resistance matter? Because big players can't fill huge orders without a crowd on the other side. A volume spike that pushes price through a level and then reverses is often the footprint of large orders being filled against the crowd — a fakeout, not a real breakout.
This content is for educational purposes only. Nothing here is financial advice or a recommendation to buy, sell, or trade any specific asset. Trading carries real risk, including the loss of your entire investment. Always do your own research, only trade with money you can afford to lose, and consult a licensed financial professional before making decisions.