Lesson 09 | Seven TradingView Tips & Tricks
I spent the first few weeks of my trading journey staring at TradingView like it was trying to insult me personally.
Lines everywhere. Buttons I was too scared to click. A toolbar that seemed to grow new icons every time I looked at it. I was convinced that real traders must have done some kind of course I'd missed, because nobody had told me half of what this thing could actually do.
Turns out, they hadn't. I was just using about 10% of it.
These are the seven things I wish I'd known sooner. Some of them you set up once and forget about. Others are actual skills that get better every time you open a chart. Either way, once you know them, TradingView stops feeling like the enemy.
If you haven't set it up yet, go back to Lesson 05 first. This one builds on that foundation.
1. Learn to find your wave
Before you draw anything, before you add a single indicator, you need to be able to see the move.
Not every candle. Not the last three days squished together. The wave. The actual shape of what price has been doing.
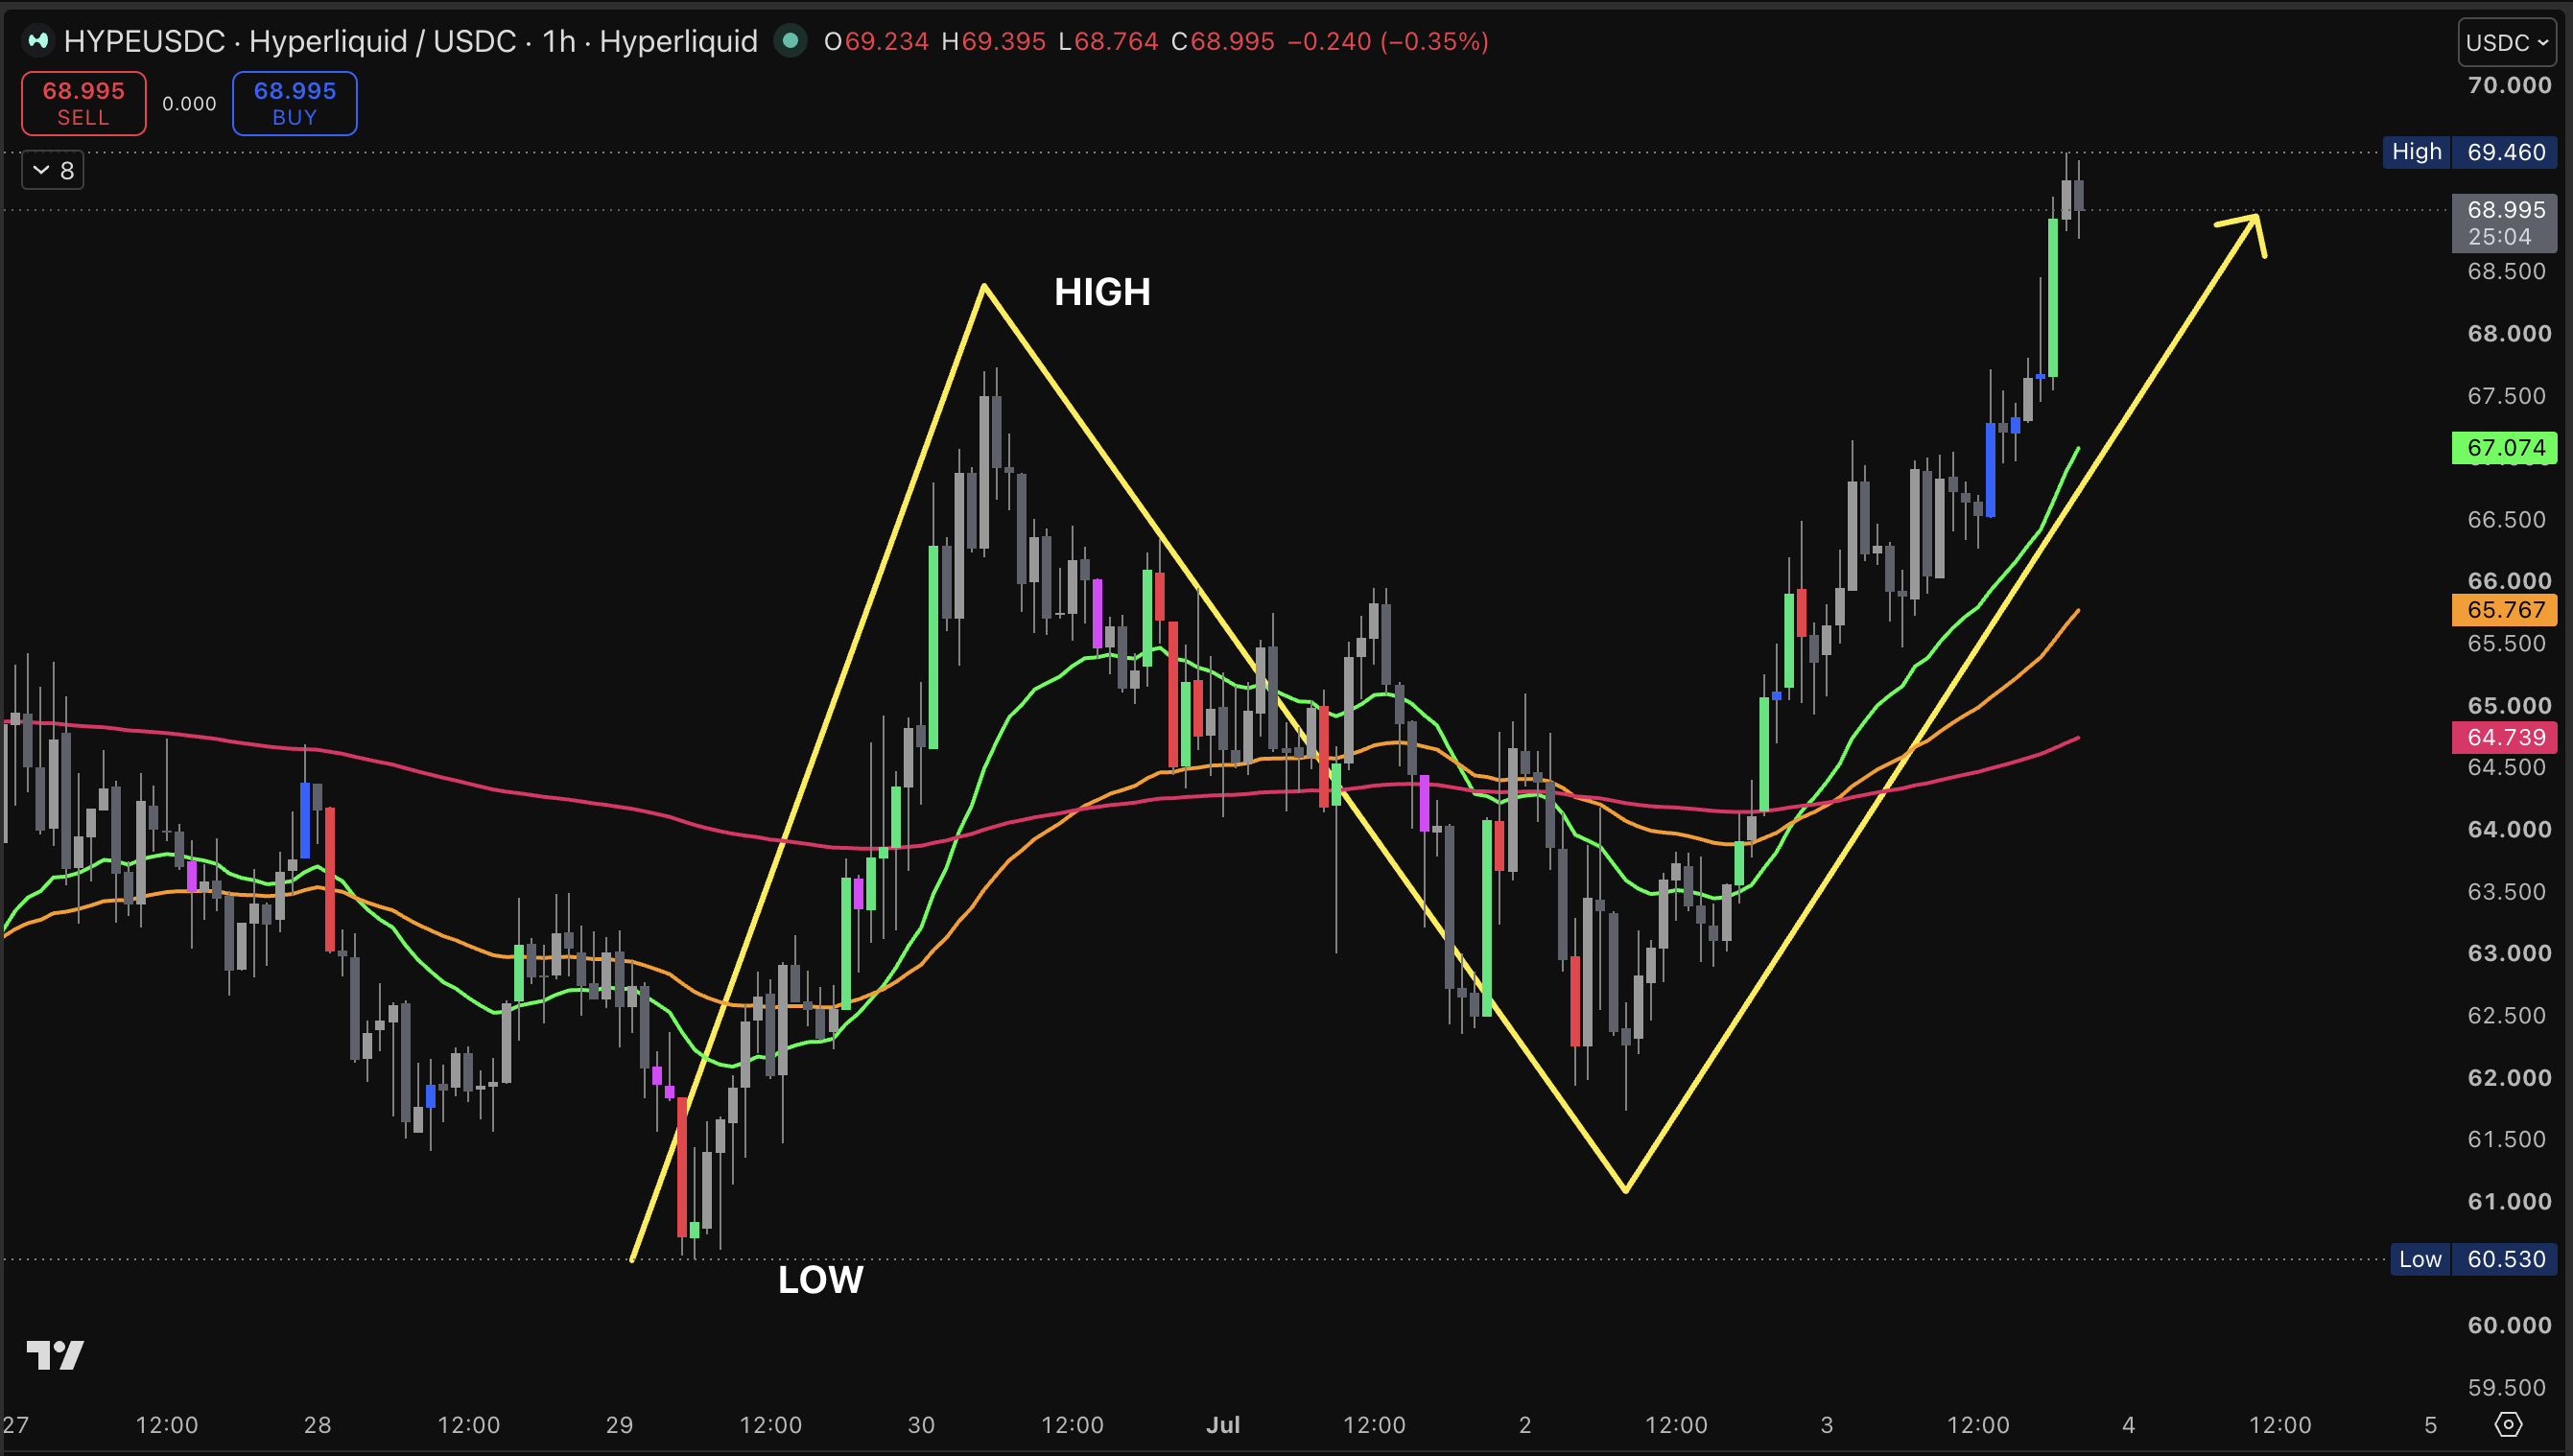
If you're looking for a long trade, you're looking for the last low - the bottom of the most recent move down. If you're looking for a short, you want the last high. That reference point is everything. And you cannot see it when your chart is jammed into a handful of candles.
The fix is simpler than you think. Drag the price axis on the right side to stretch the chart vertically. Drag the time axis along the bottom to control how far back you're looking. Zoom out enough to see the trend, then zoom back into the wave that's happening right now.
How far back? As far as the last wave runs. On the 1H chart, that's usually 4-5 days. On the 4H, sometimes 2-4 weeks. There's no magic number. Let the wave tell you.
And if your chart gets away from you, double-click either axis and it snaps straight back to normal. You'll use that more than you think.
2. Stop guessing which levels matter
Once you can see the wave, the next question is always the same: which prices on it actually mean something?
Most beginners guess. Draw a line here, draw a line there, hope for the best. There's a much better way.
Search for SpacemanBTC Key Levels in the indicators bar and add the free version, the one labelled IDWM. What it does is plot the levels the whole market is already watching: daily and weekly opens and closes. All of it, automatic, sitting right on top of your wave.
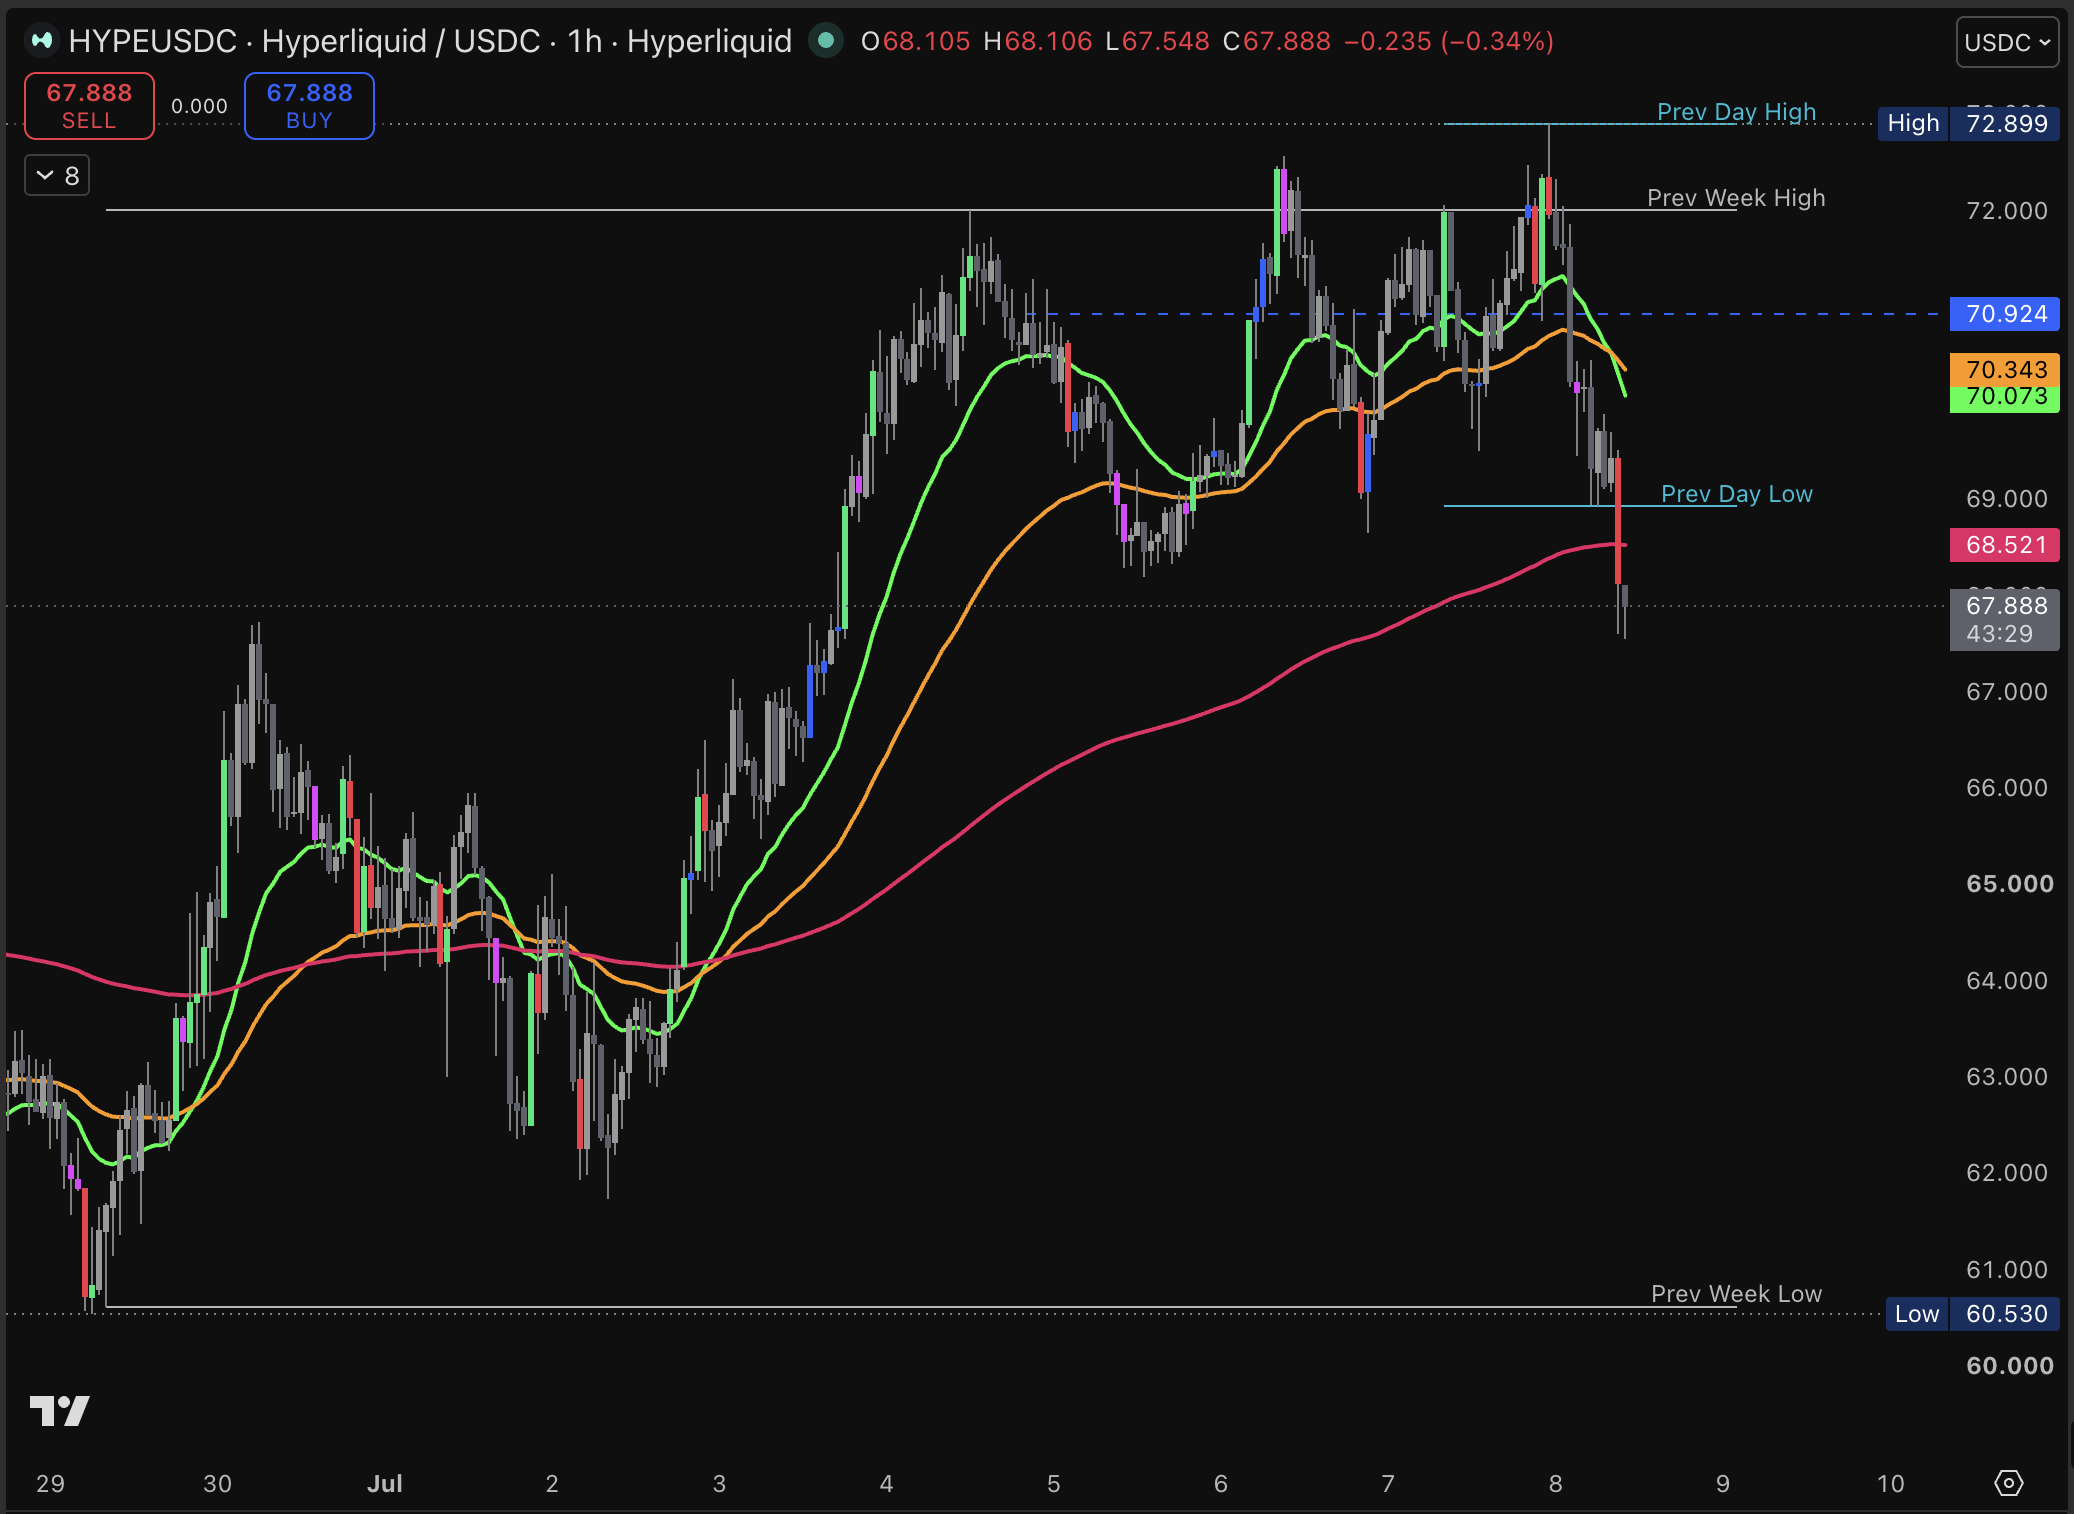
Why do these matter? Because the higher the timeframe, the more the market cares about a level. The weekly open isn't just a line. It's the price that the whole market has been measuring against all week. Price reacts there, it bounces, it breaks, sometimes it pokes through and whips straight back.
Instead of guessing, you've got a map.
3. Set your chart up once, then leave it alone
This one is for the moms who rebuild their indicator setup from scratch every time they open a new chart. Stop.
Get your indicators exactly how you want them. Then go to the layouts menu at the top of your screen, save it, and give it a name. Done. Now every chart you open -Bitcoin, gold, stocks - loads your full setup automatically. No rebuilding. No need to forget which indicators you added last time.
Then right-click on the canvas, open Settings, and sort out the look. Your candle colours, your background. Whatever is easiest on your eyes at 6am before the kids wake up. Save it as your default, and it's there every morning.
4. The Risk/Reward tool: What all those numbers mean
This is the one most beginners either avoid completely or use without really understanding what they're looking at. Let's fix that.
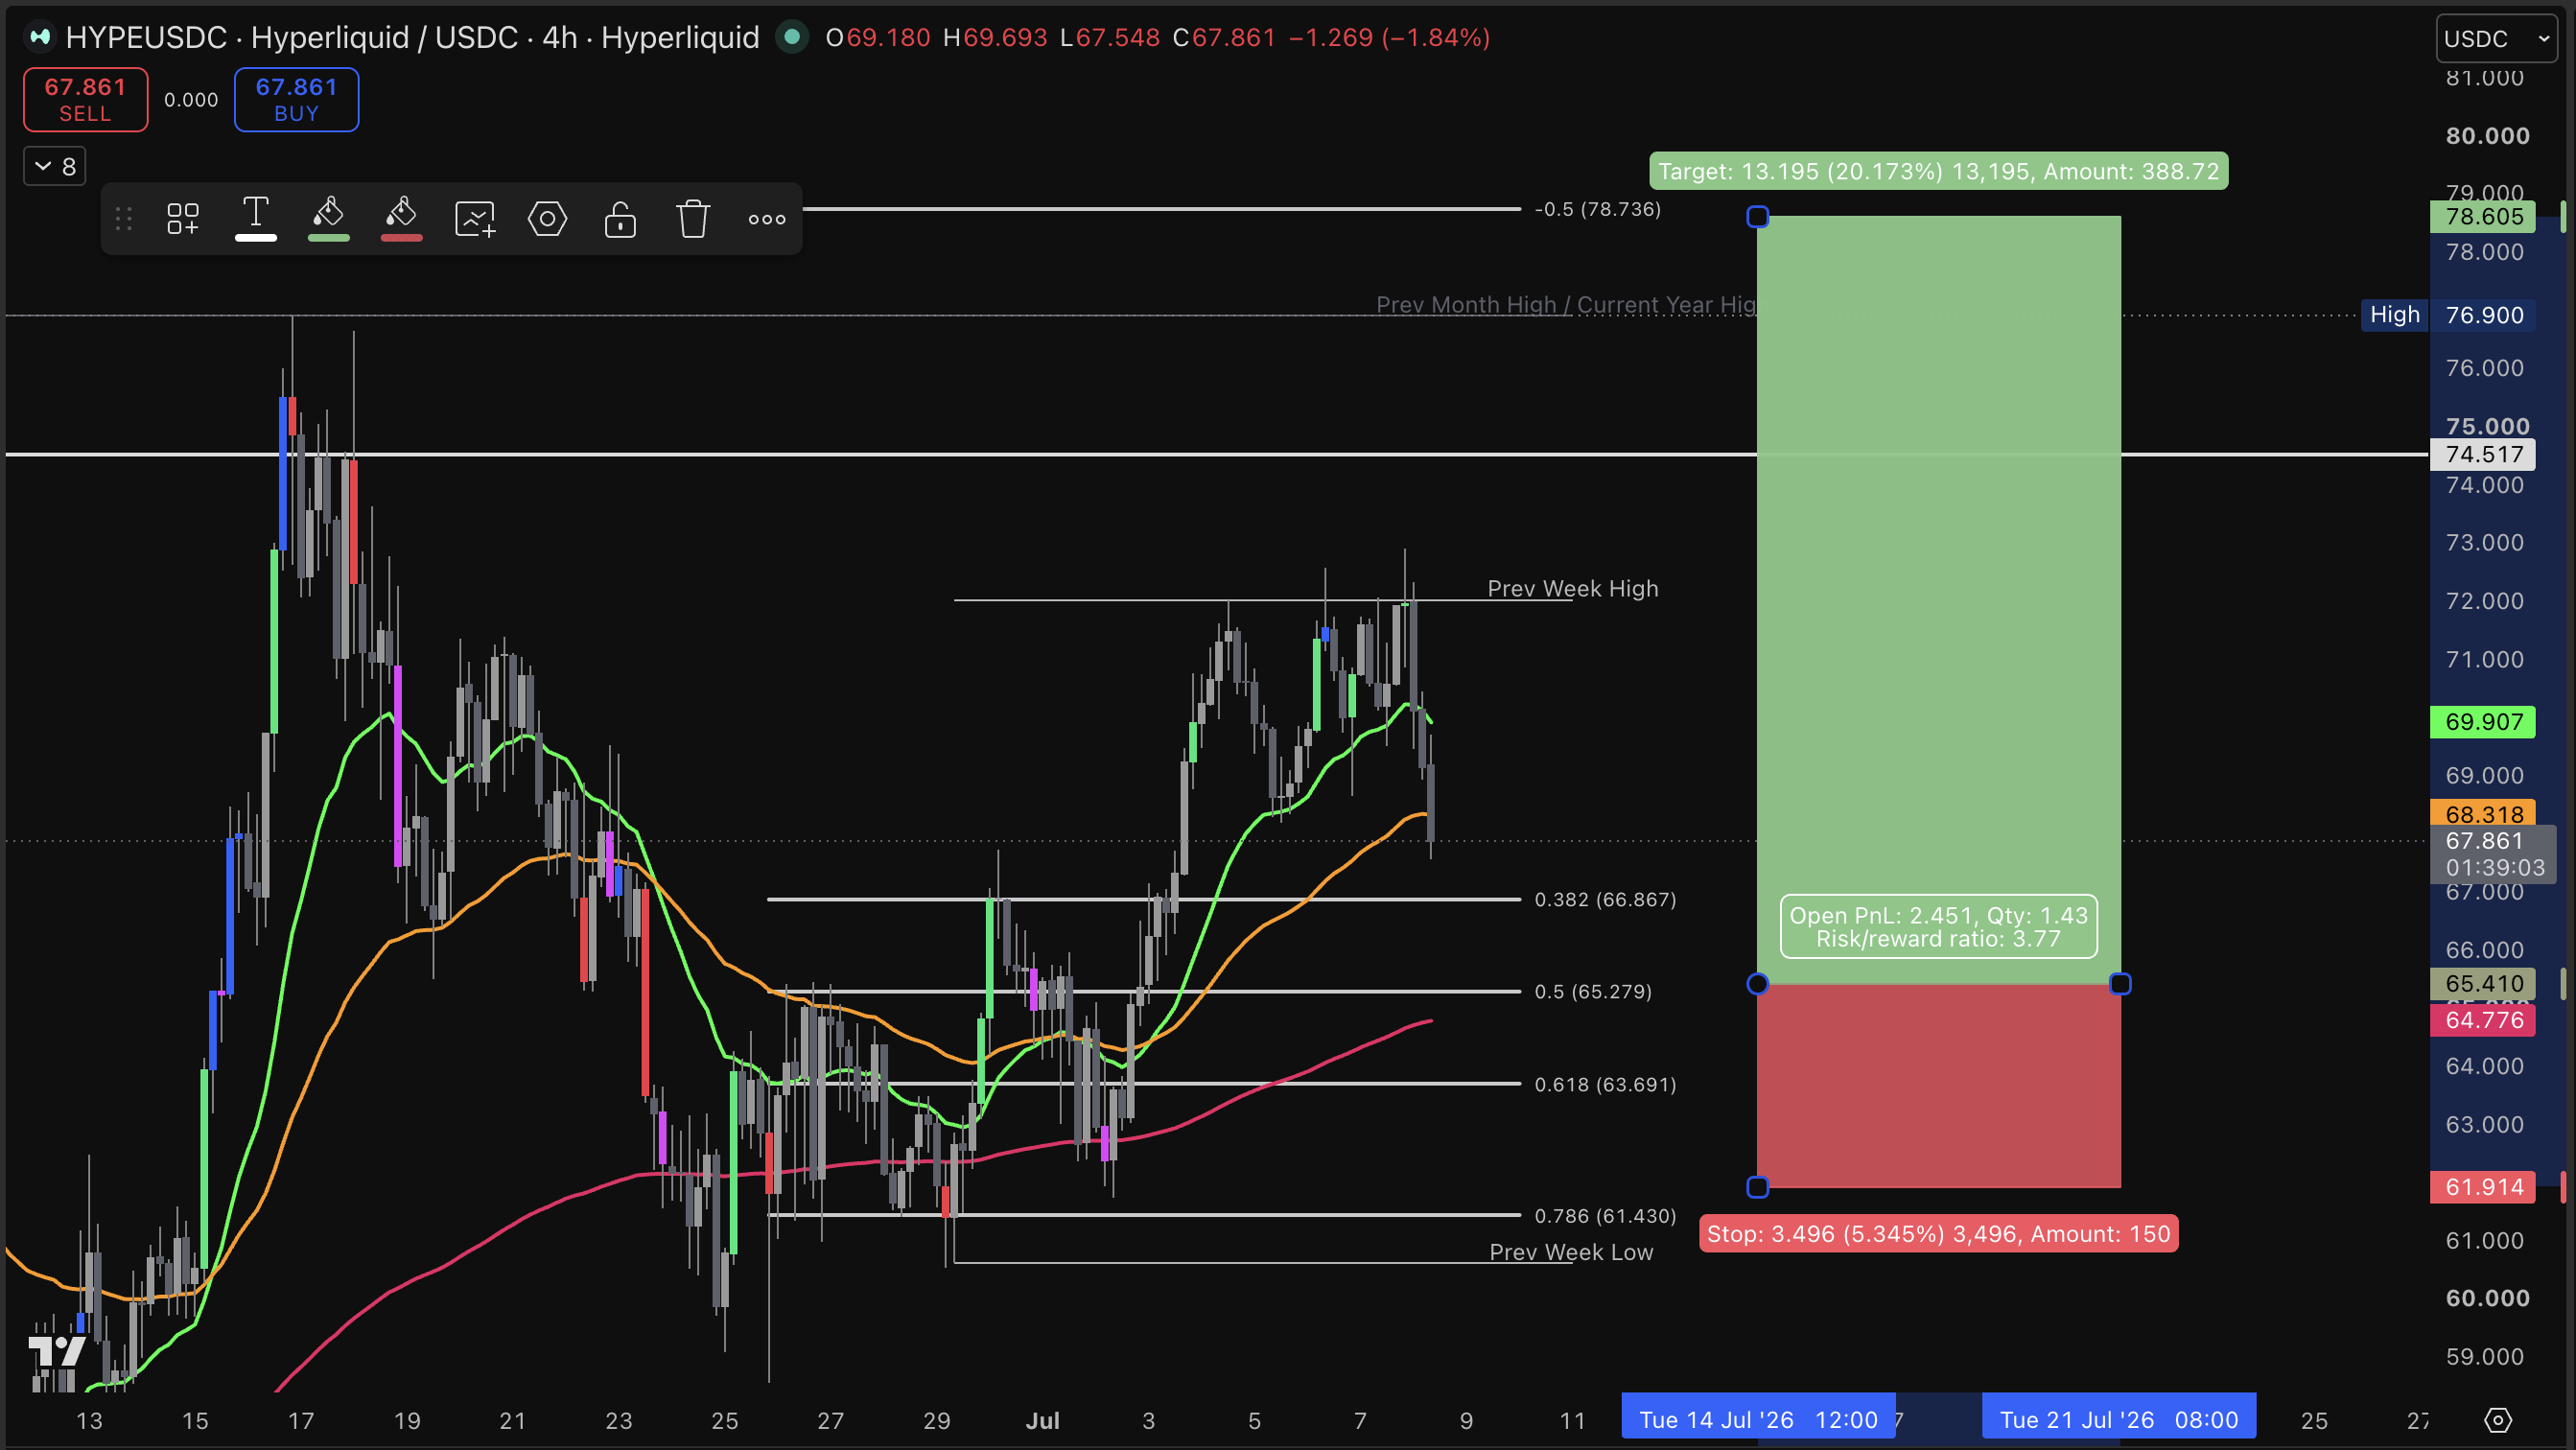
Find the Long Position tool in your left toolbar. Click it, then click somewhere on your chart. A box appears, green on top, red on the bottom.
The line where you clicked is your entry, where you're planning to get in.
Drag the bottom of the red zone down to your stop loss, the point where you'd admit you were wrong and get out. The tool shows you exactly how much you'd lose if price gets there, both as a percentage and as a dollar amount if you've added your account size.
Drag the top of the green zone up to your target, where you'd take profit. Same information, but in your favour.
And right there in the middle, the number that matters most. Your risk-to-reward ratio. A 2 means you're risking 1 to potentially make 2. A 5 means you'd make 5 for every 1 you risk. The bigger that number, the better the trade looks before you place it. If it drops below 3? Walk away. You'd be risking more than you stand to gain.
There's a Short Position tool right next to it for when you're looking at a downward move. Same thing, just flipped.
Drag the boxes around to match your actual plan, and everything updates live. You get to see whether a trade is worth taking before you risk anything.
5. Magnet mode, and when to switch it off
You've drawn a line. It lands slightly off. A touch above the high, a touch below the low. You zoom in, nudge it, zoom out, nudge it again. There is a better way.
The magnet icon sits in your left toolbar. Switch it on, and your lines snap to exact candle wicks, the very tip of the high or the low. No squinting. No nudging. It just grabs the right spot.
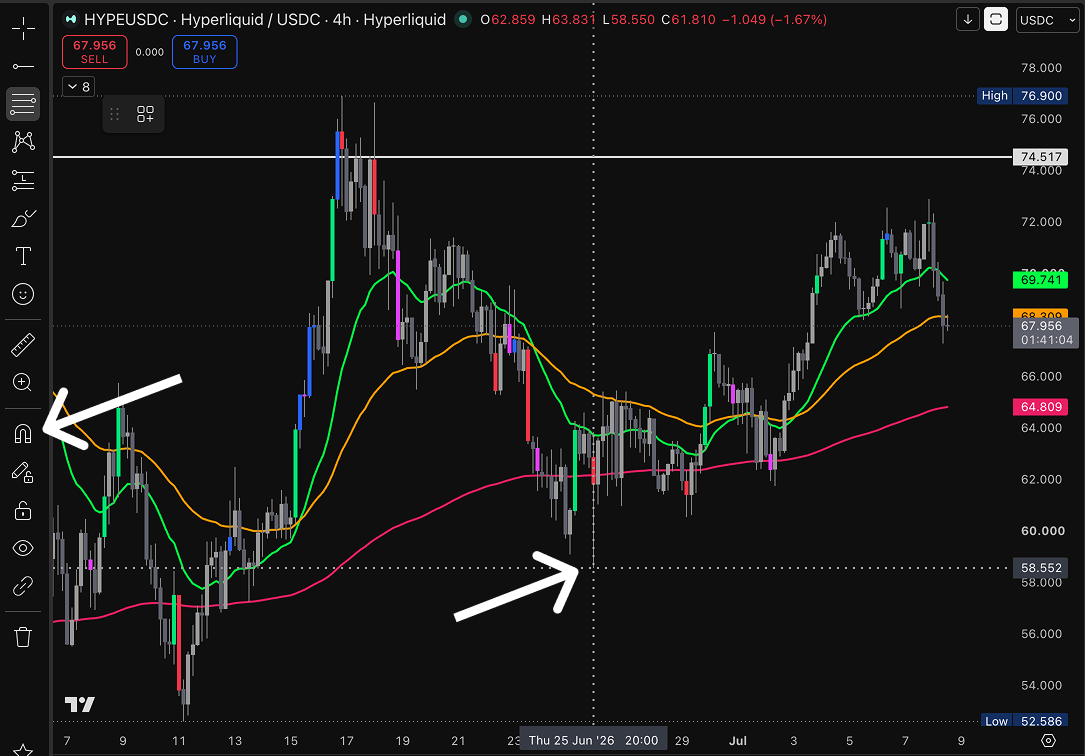
For Fibs and trend lines, this is a game changer. You need the precise top or bottom of a move, and the magnet hands it to you instantly.
But, and this is the bit nobody mentions, for horizontal levels and your Risk/Reward box, the magnet fights you. It keeps snapping to places you don't actually want. So the real skill is keeping it one click away and toggling it as you go. On for Fibs and trend lines. Off for everything else.
Your levels go from roughly right to exactly right.
6. Give yourself room to think
When I start charting - drawing support and resistance, placing my Fibs - I want as much clean space as I can get. A crowded screen makes everything harder to see.
Two things that help. First, collapse your watchlist, that panel on the right side. Your chart stretches out wider the moment it disappears.
Second, double-click anywhere on the chart. That tucks away your Stochastic, your BBWP, all the indicator panels at the bottom, and gives all that space back to the price action.
Now it's just you and the chart. Clean. Room to see structure, draw your levels, place your Fibs without fighting for space.
Once everything is drawn in, double-click again to bring the indicators back. Then check that the whole picture makes sense together; your levels, your momentum, your volatility reading, all on one screen. That's your confirmation.
7. Flip your chart upside down
This is the one I promised at the start. And it's genuinely one of the most useful things I've learned.
Right-click on the price axis - the numbers running down the right side - and open Settings.
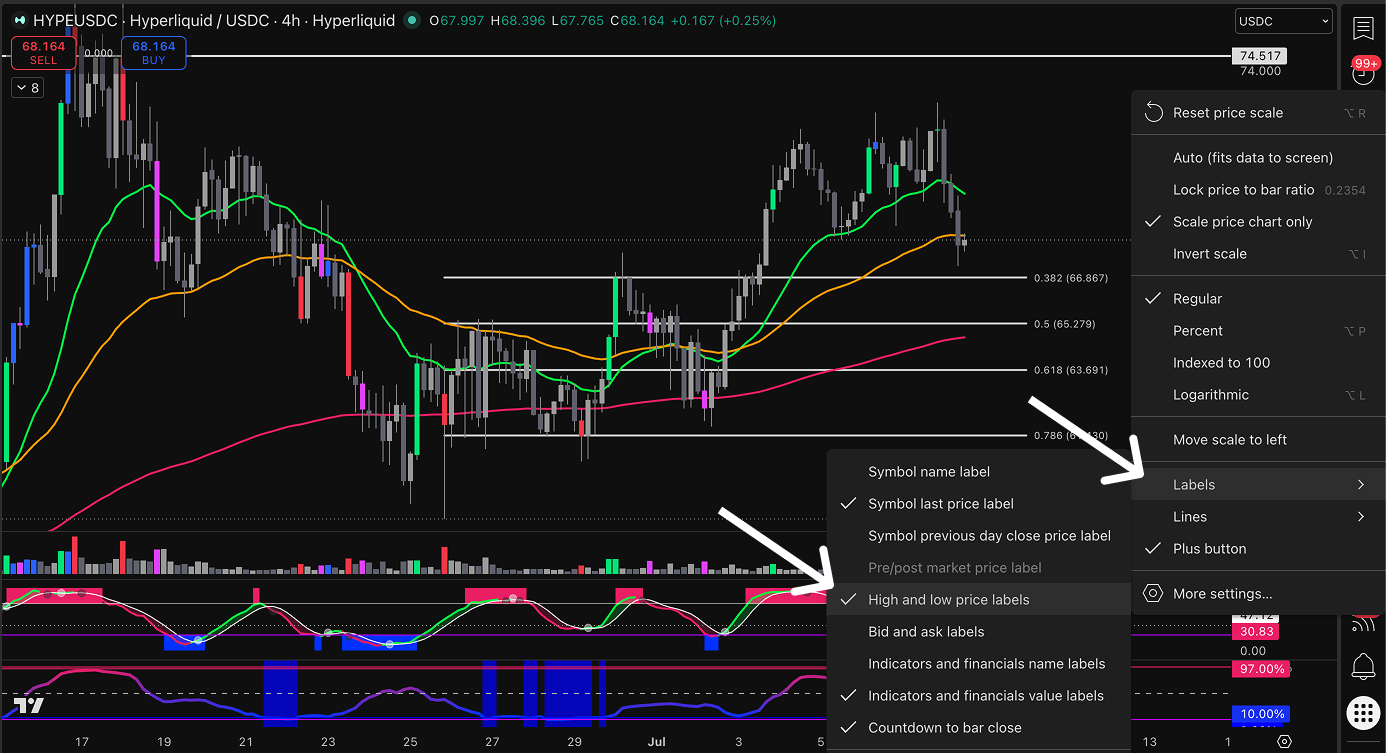
First, turn on high and low price labels. TradingView will now mark the exact highest and lowest price visible on your screen automatically. No more squinting for the top of a move.
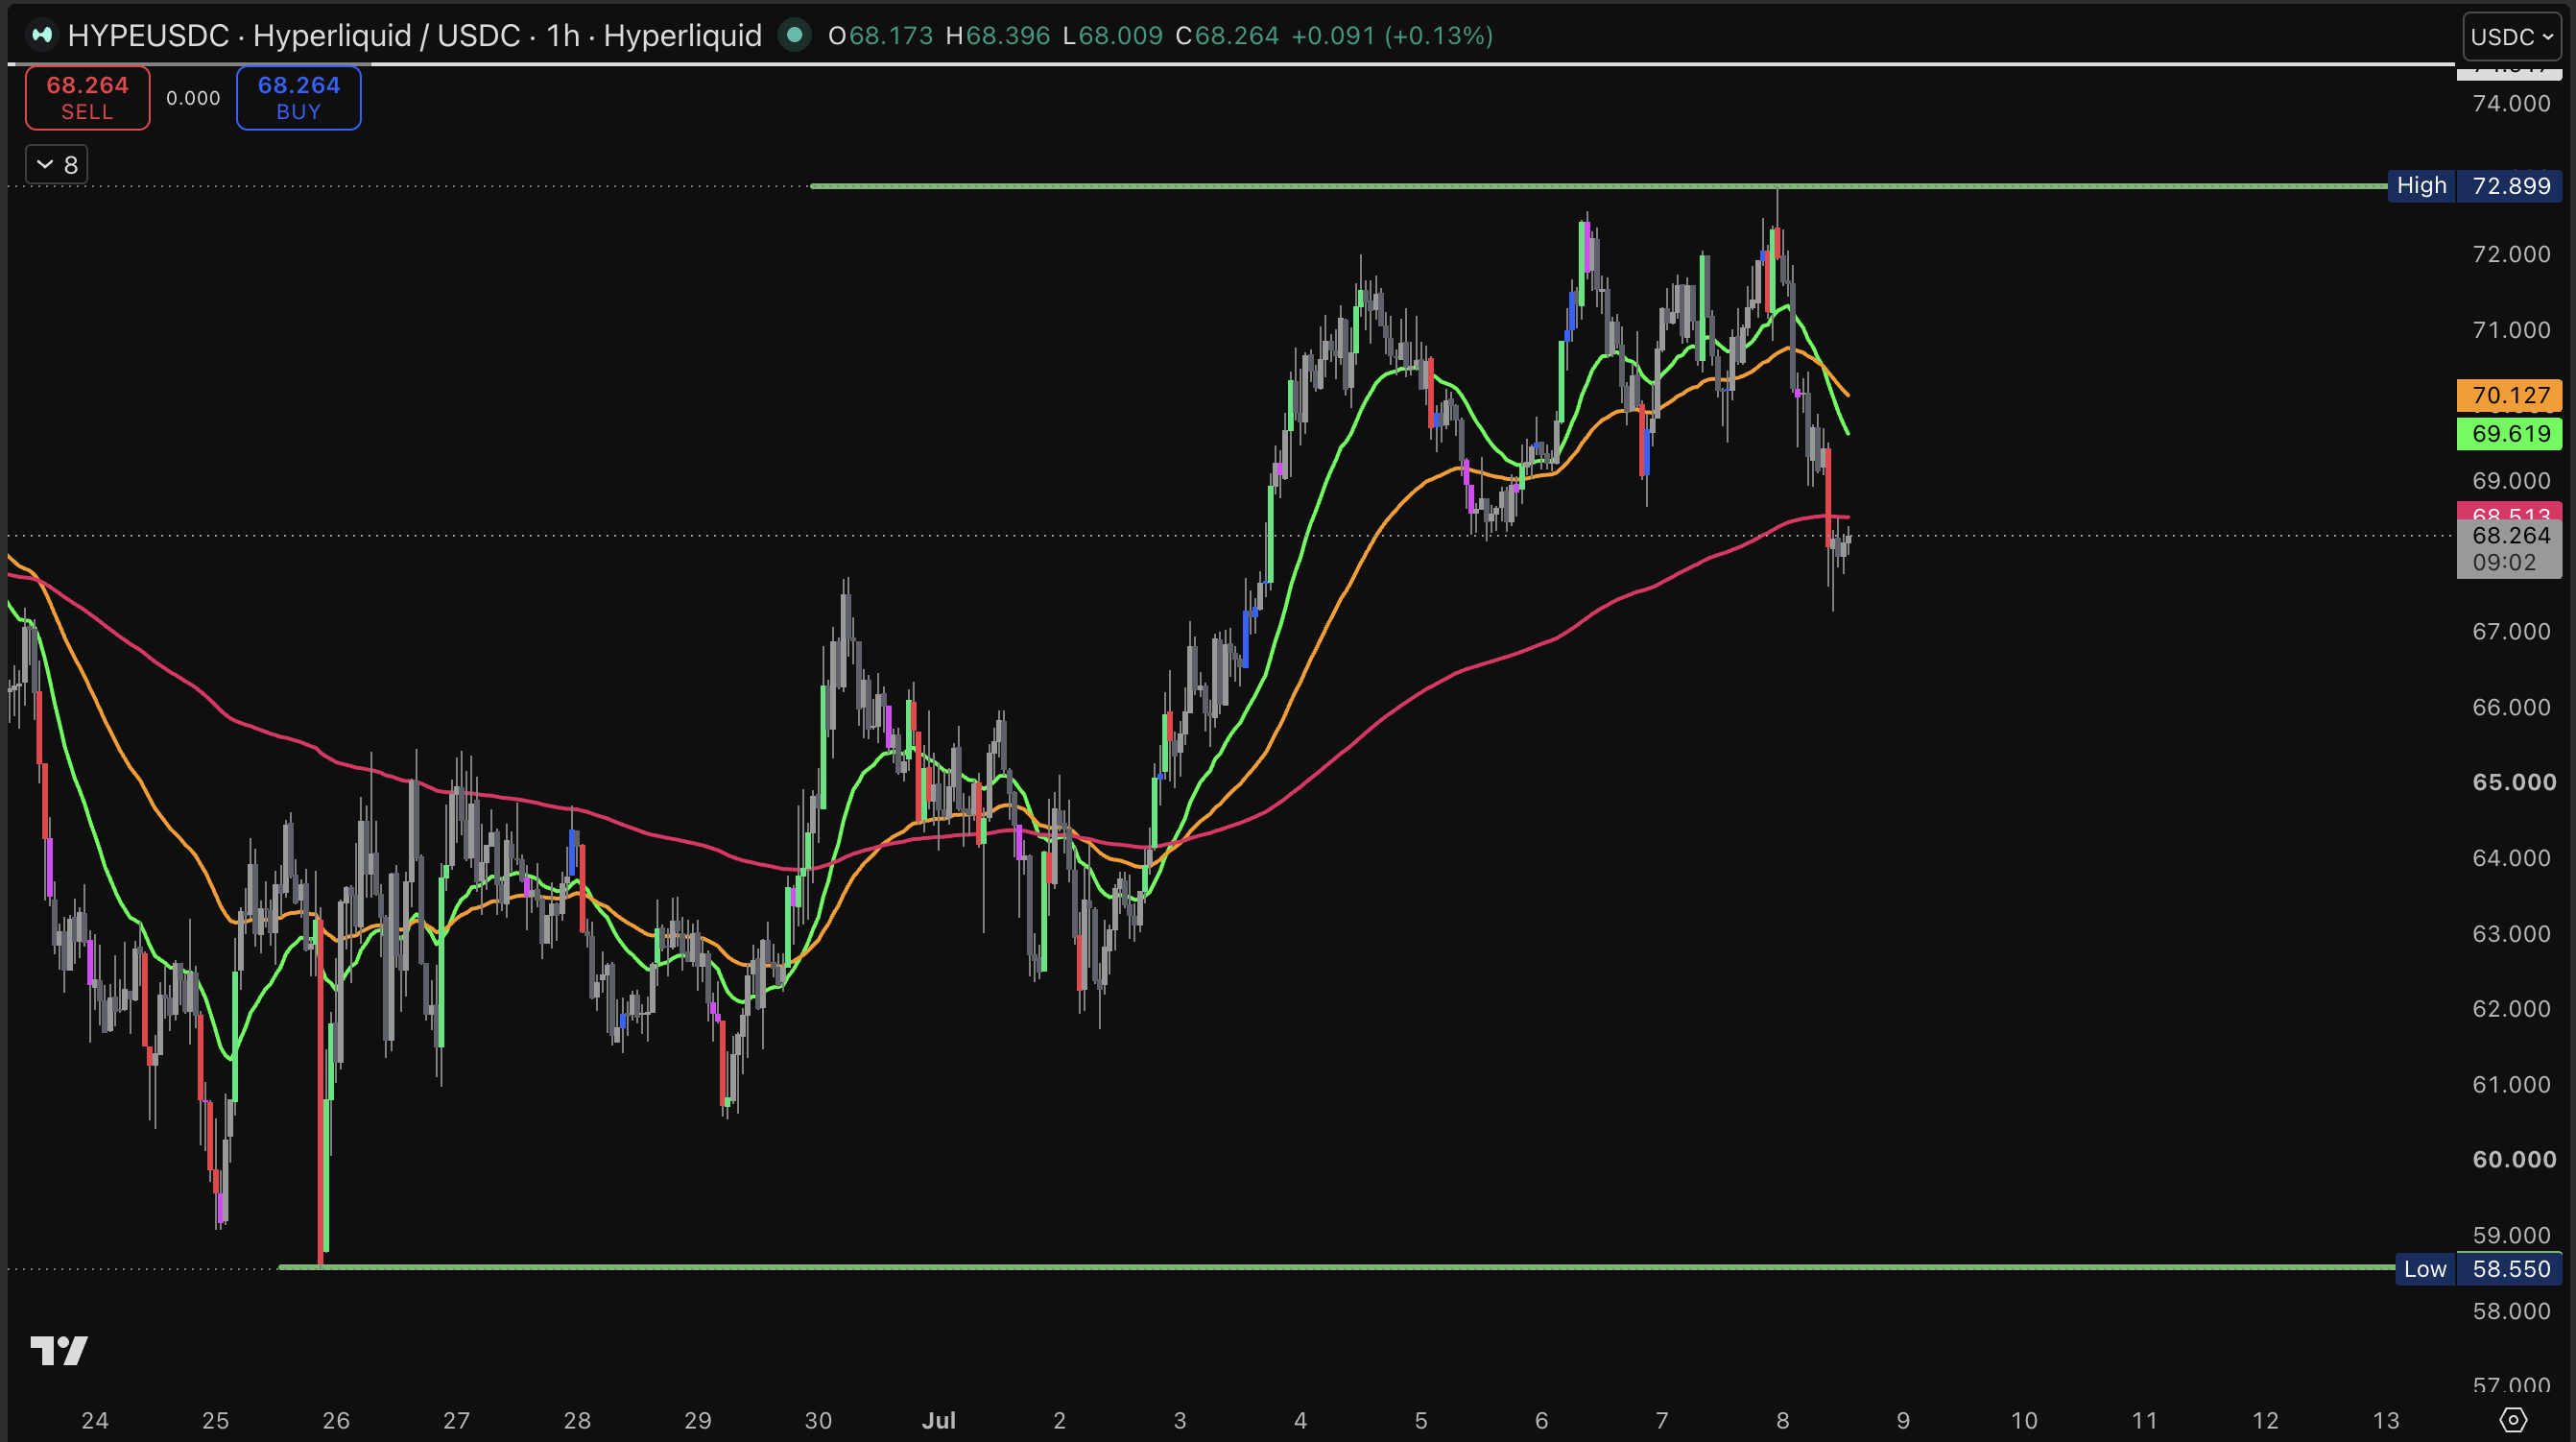
Now the big one. Hit Invert Scale.
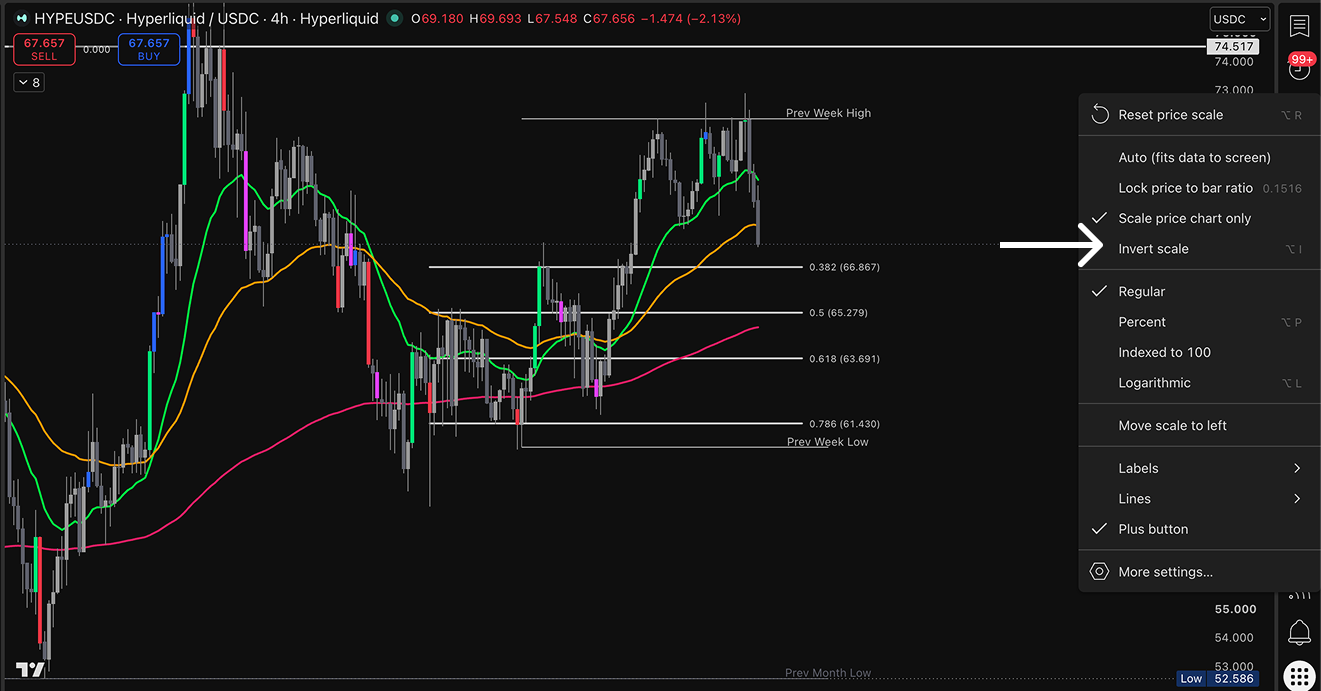
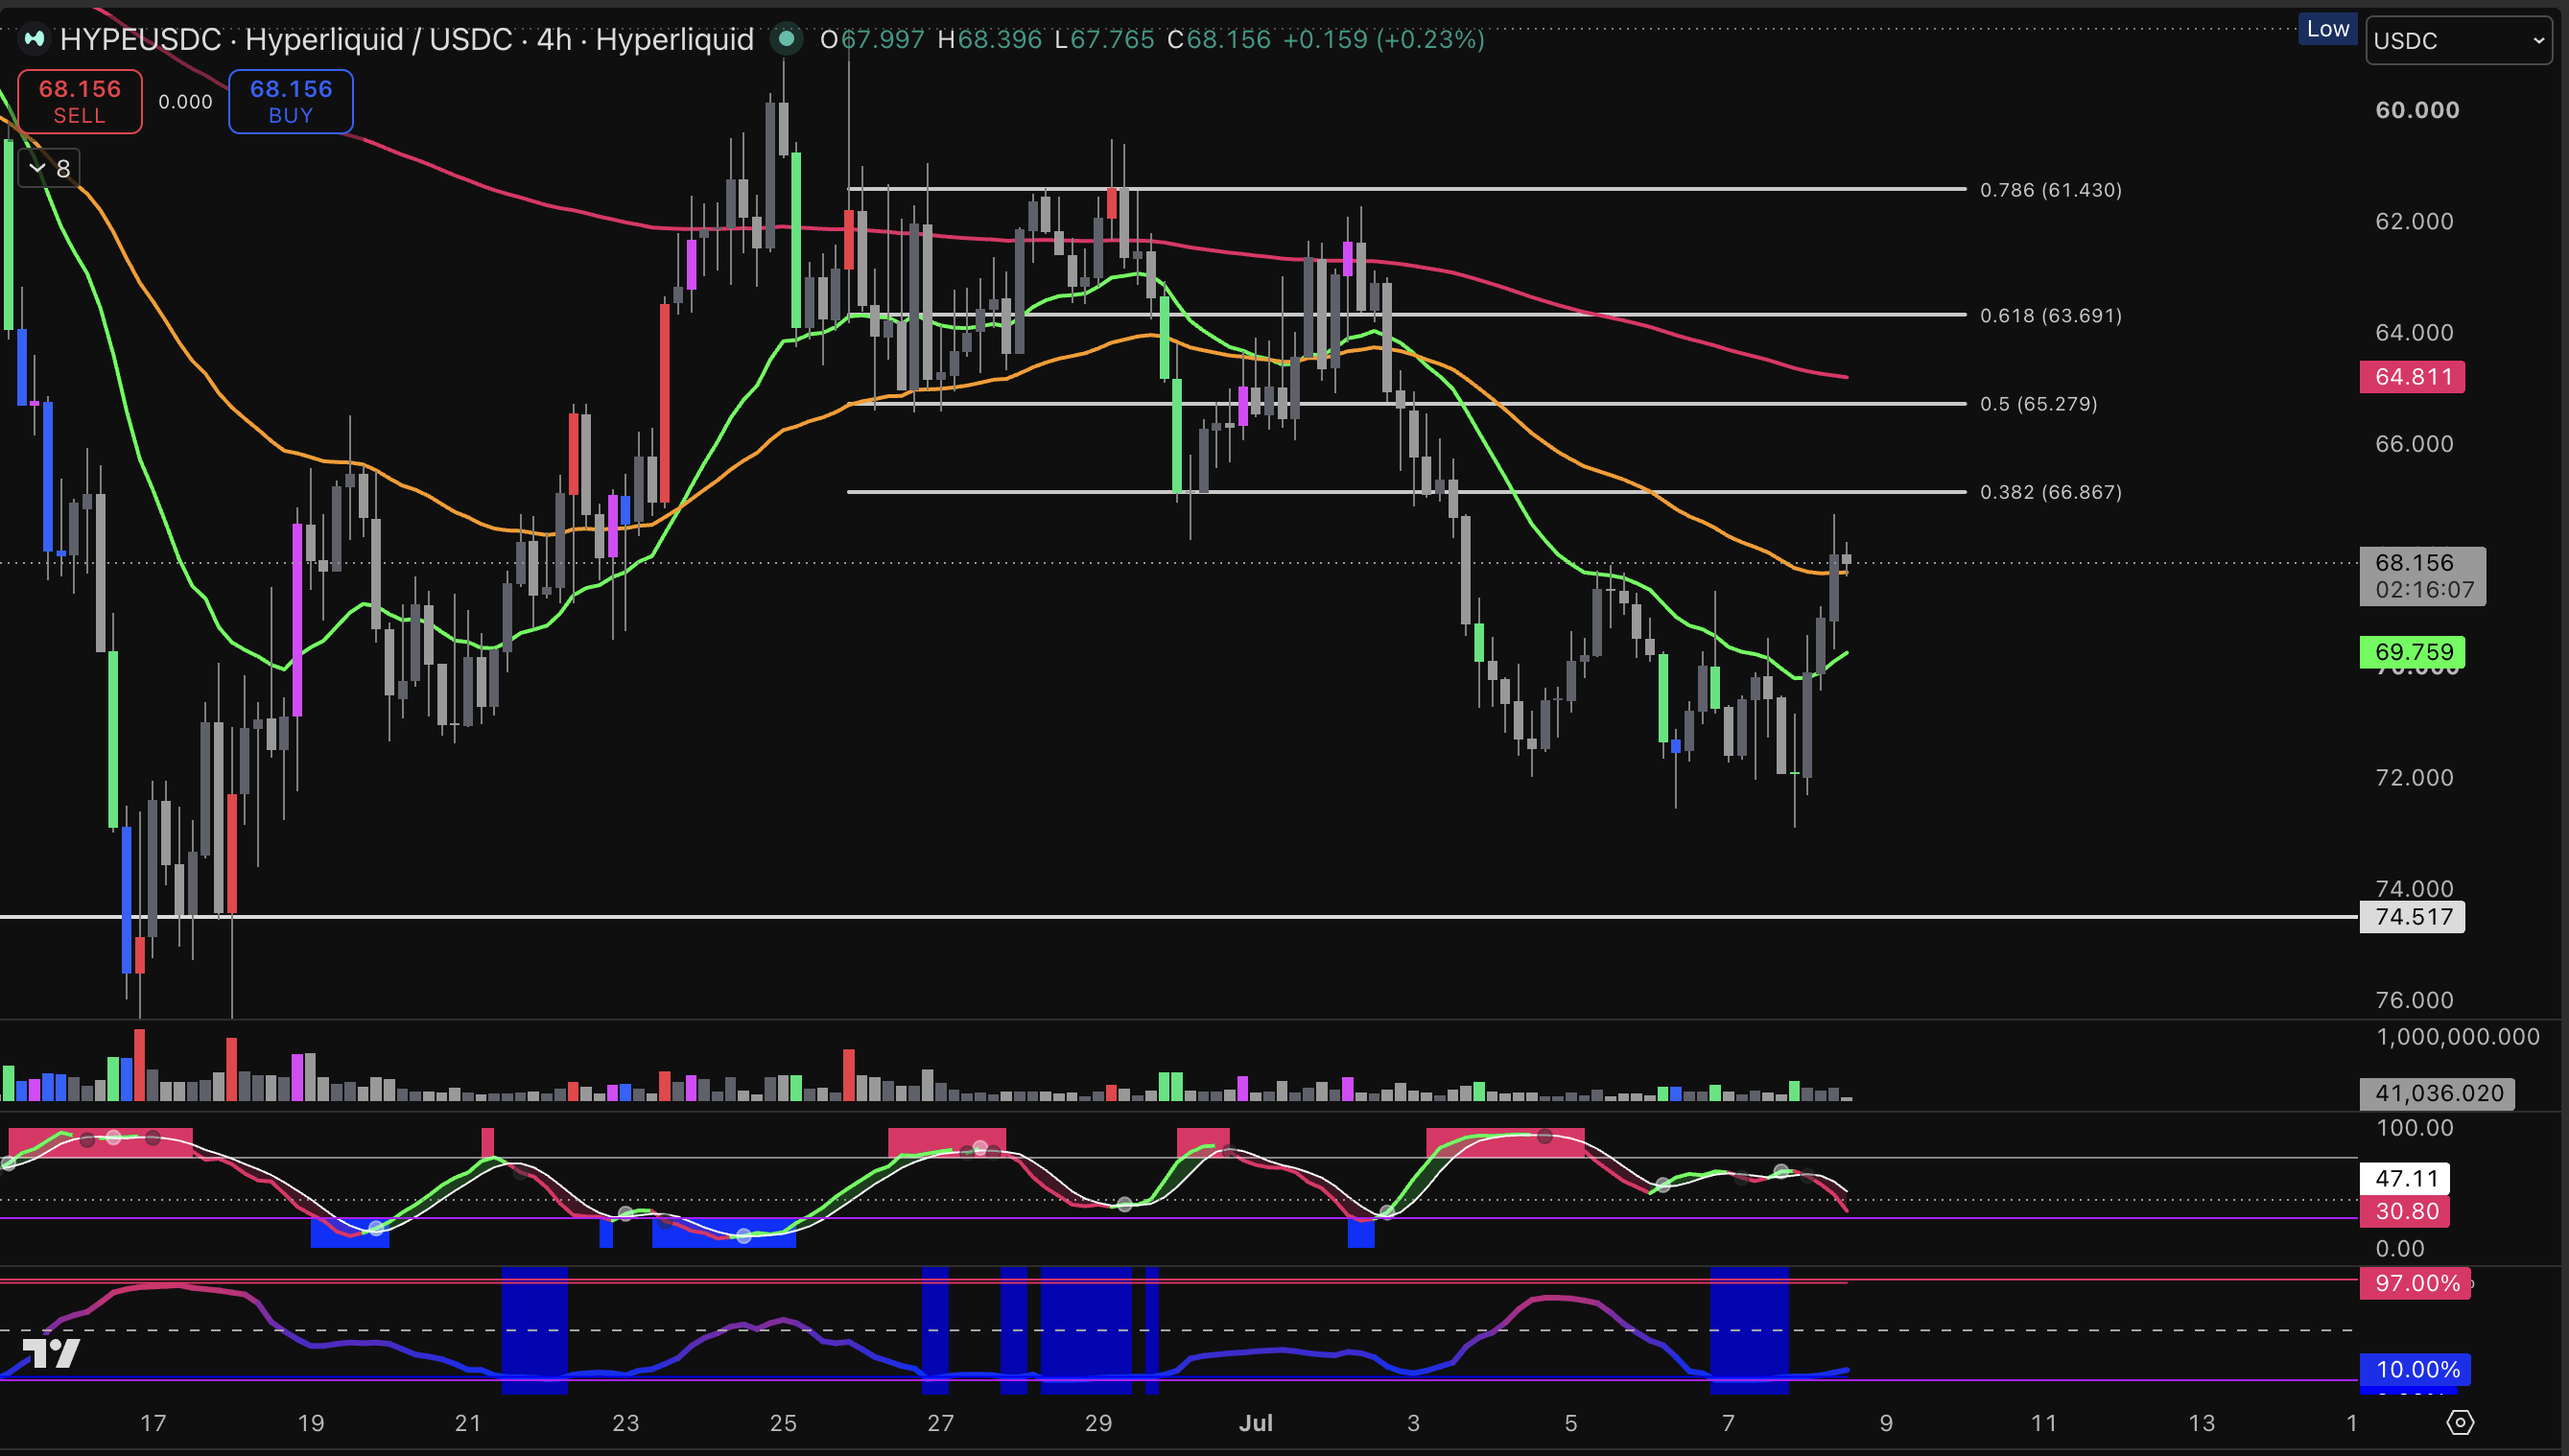
Your whole chart flips upside down.
Imagine you've been looking at a chart with a beautiful support line. Price keeps bouncing off it. It looks like a clean, obvious long. You flip it, and suddenly that beautiful support is now resistance, and that obvious long looks like a very obvious short.
Here's why that matters. We all see what we want to see. If you've decided a trade is going up, your eyes go hunting for reasons to agree with you. They'll find them. That's just how brains work.
Flipping the chart removes that bias in one second. If your gorgeous long still looks like a good trade upside down, great. If it suddenly looks terrible, that's your answer. Your gut was fooling you.
One click. The chart tells you the truth.
A few things before you go...
These seven don't all need to happen at once.
Some of them - your layout, your colours, your key levels - you set up one time, and they run quietly in the background forever. Making you faster without you thinking about it.
The rest are skills. Reading your wave. Toggling the magnet. Flipping the chart to check your own bias. Those get sharper every single time you open TradingView. Every chart is a rep.
So don't try to master all seven this week. Set up the permanent ones today. Pick one skill and practice it on every chart you open.
You'll be surprised how fast it clicks.
You've got this. 💚 Mel
Frequently Asked
Which TradingView tip should beginners learn first? Start with the two that run quietly in the background forever: save your indicator layout, and add the SpacemanBTC IDWM Key Levels indicator. That's a one-time setup that makes every chart clearer. Then practice reading the wave and using the Risk/Reward tool.
How do I save my TradingView layout? Set up your indicators, colours and chart style once, open the Layouts menu at the top, save it and name it. Every chart you open after that will load your saved setup automatically.
What is magnet mode on TradingView? The magnet icon in the left toolbar snaps your drawing tools to the exact tip of a candle's high or low. Ideal for Fibs and trend lines. Toggle it off for horizontal lines and the Risk/Reward box, where you want to place points freely.
What does the invert scale option do on TradingView? Right-clicking the price axis and hitting Invert Scale flips your chart upside down. It's a bias check: if your long still looks like a good trade inverted, the setup is real. If it suddenly looks terrible, your eyes were fooling you.
How do I use the Risk/Reward tool on TradingView? Click the Long Position tool in the left toolbar, then click your entry price on the chart. Drag the red zone down to your stop loss and the green zone up to your target. The tool shows your risk, reward, and R:R ratio live. Anything under 3:1 is a walk-away.
This content is for educational purposes only. Always do your own research before making any trading decisions.