Lesson 10 | Five Signals That Change How You Read a Chart
There's a difference between someone who reads a chart and someone who just stares at one.
For a long time, I was the one staring. I'd open TradingView, look at all those candles moving up and down, and feel absolutely nothing useful. No idea what I was supposed to be seeing. No idea what actually mattered.
Turns out, most of what I was staring at was noise. These five things changed that. And the last one, number five - is the hidden signal that most beginners never even know exists.
1. Candle bodies: confirmation, not prediction
Here's the mistake almost every beginner makes. They sit there reading every single candle like each one is telling them something important.
Most of them aren't.
What you're actually doing is watching a level you've already identified, a price the market has reacted to before, and waiting for one standout candle to show up there and confirm you were right. Candles aren't a prediction. They're a confirmation.
Every candle is an argument. The wicks, those thin lines poking out the top and bottom, that's the arguing. The body is where they landed. The body is the decision.
Think about trying to decide where to go for breakfast with the family. Twenty minutes of back and forth, someone vetoing everything, and you end up making toast at home. Loads of noise. Went nowhere. That's a candle with a tiny body and long wicks.
Now the morning where everyone agrees in 90 seconds and you're out the door. That's a big full body. That's conviction.
Two patterns worth knowing:
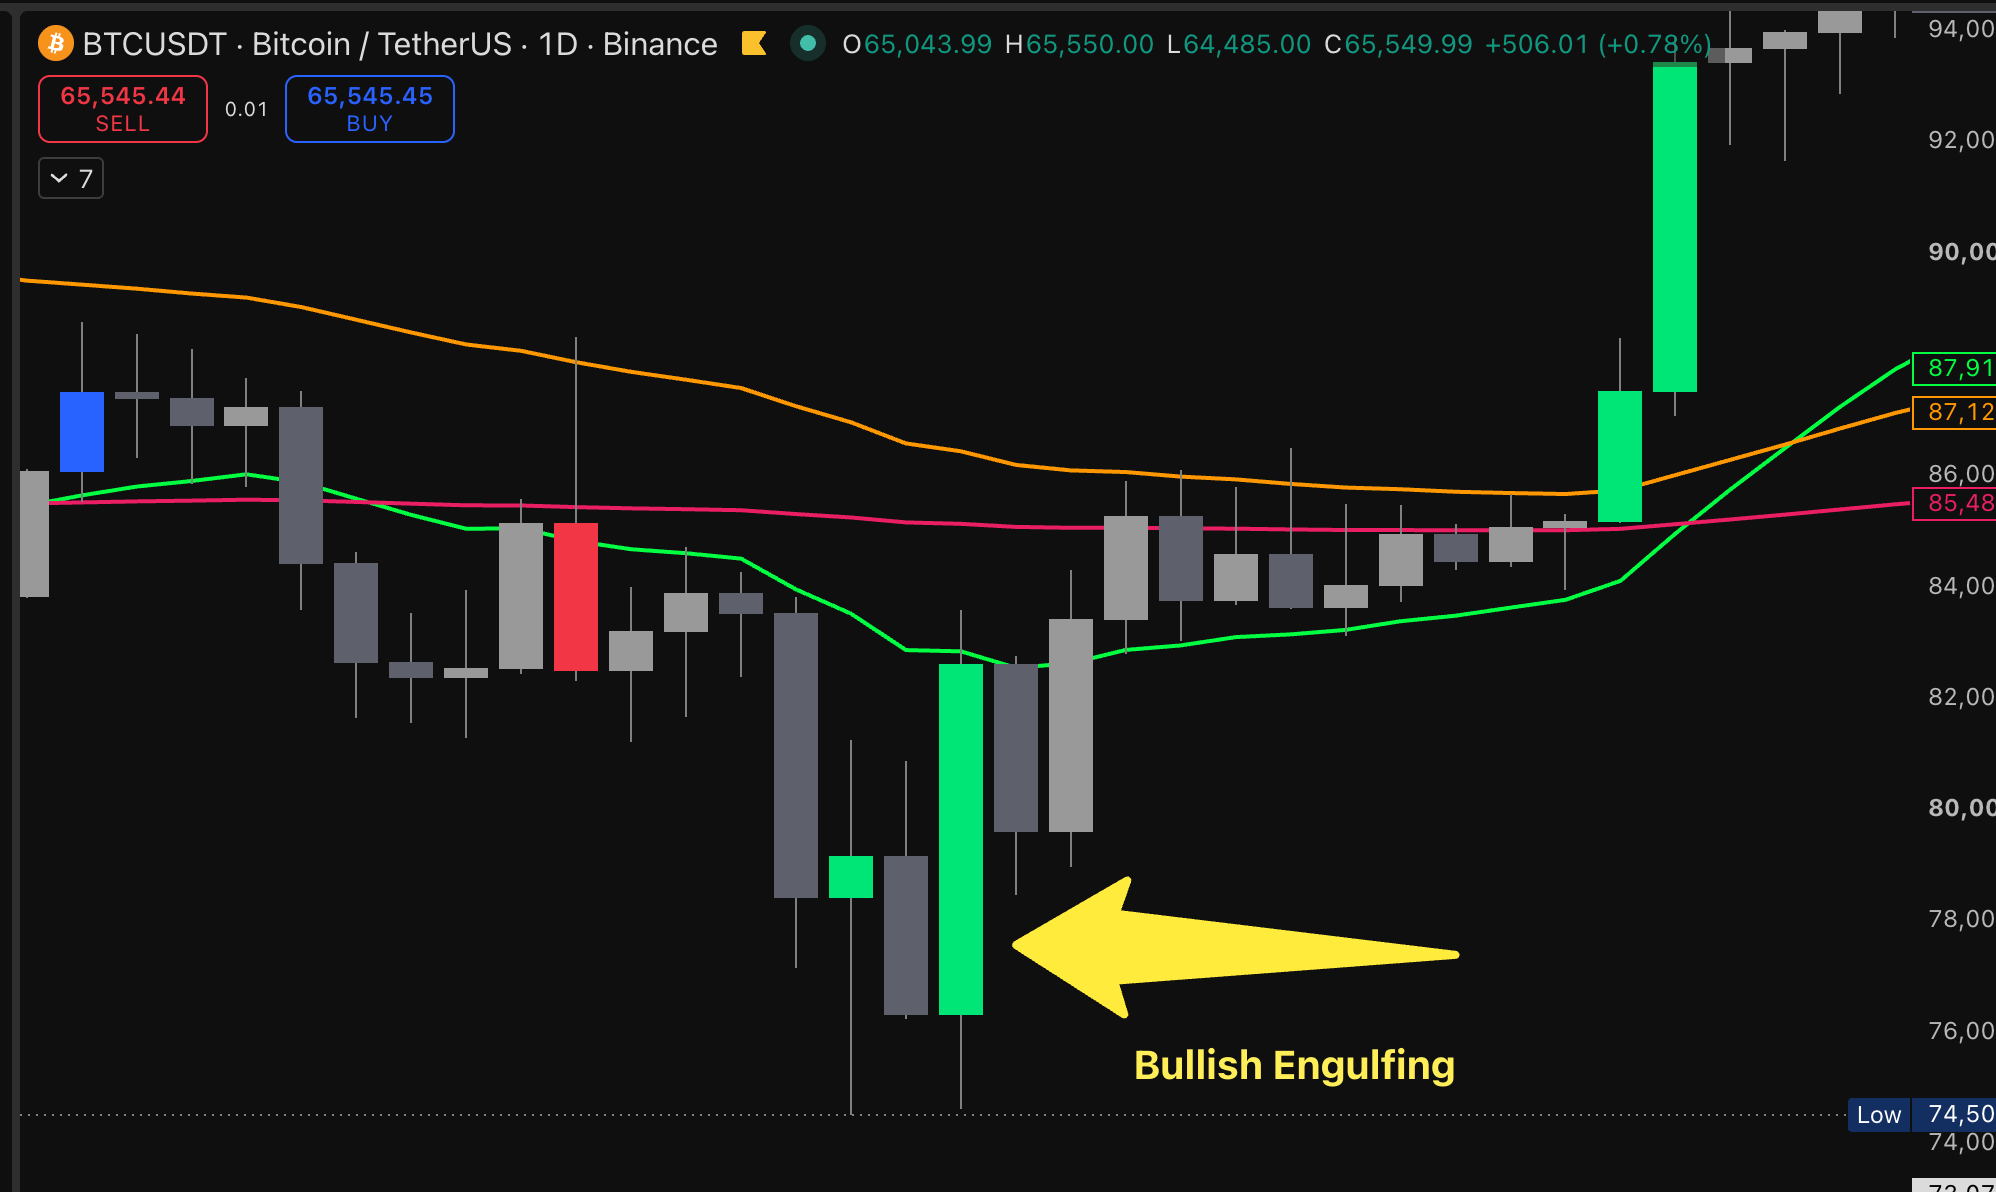
A bullish engulfing is when one candle completely swallows the candle before it. The bigger and more dramatic the swallow, the more convincing the signal. This is one side of the argument just taking over completely.
A pin bar is a tiny body with one long wick, price shot in one direction, got completely rejected, and came back. The market tried to go somewhere and changed its mind.
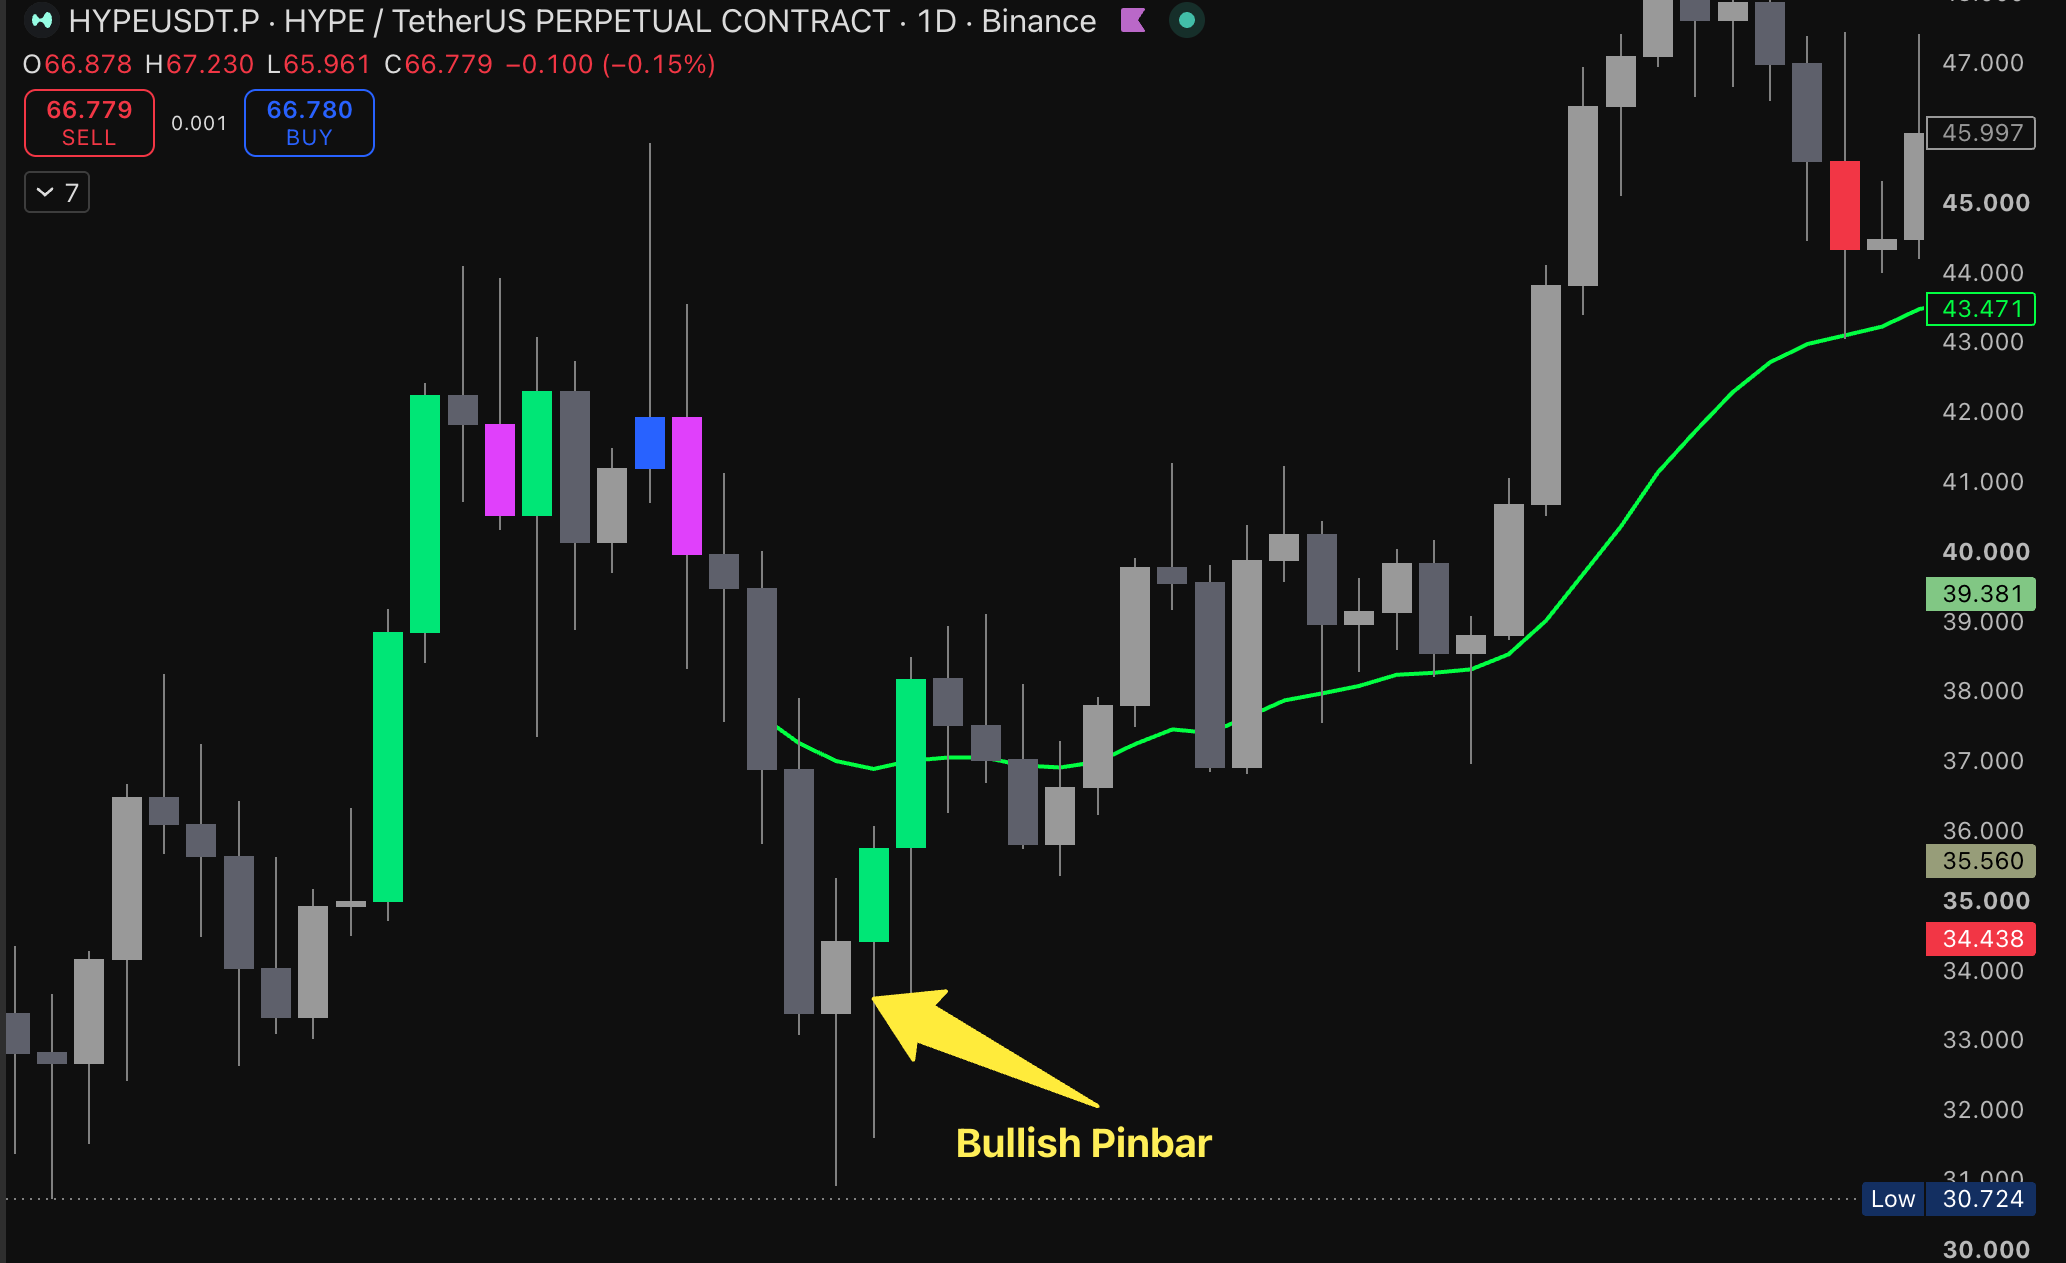
But here's the rule, and it's the most important thing in this whole post. These candles only mean something if they show up at a level that already matters. A pin bar floating in the middle of nowhere is just noise. A pin bar sitting right on a key support level, with volume behind it? That's worth paying attention to.
2. The five-minute chart is lying to you
I want you to try something next time you're looking at a chart.
Find a move that looks absolutely terrifying on the five minute. Price falling off a cliff. Heart rate going. Everything screaming at you to panic.
Then switch to the four hour chart. Same coin, same moment.
Nine times out of ten, that entire terrifying crash is one tiny little candle. The trend is completely fine.
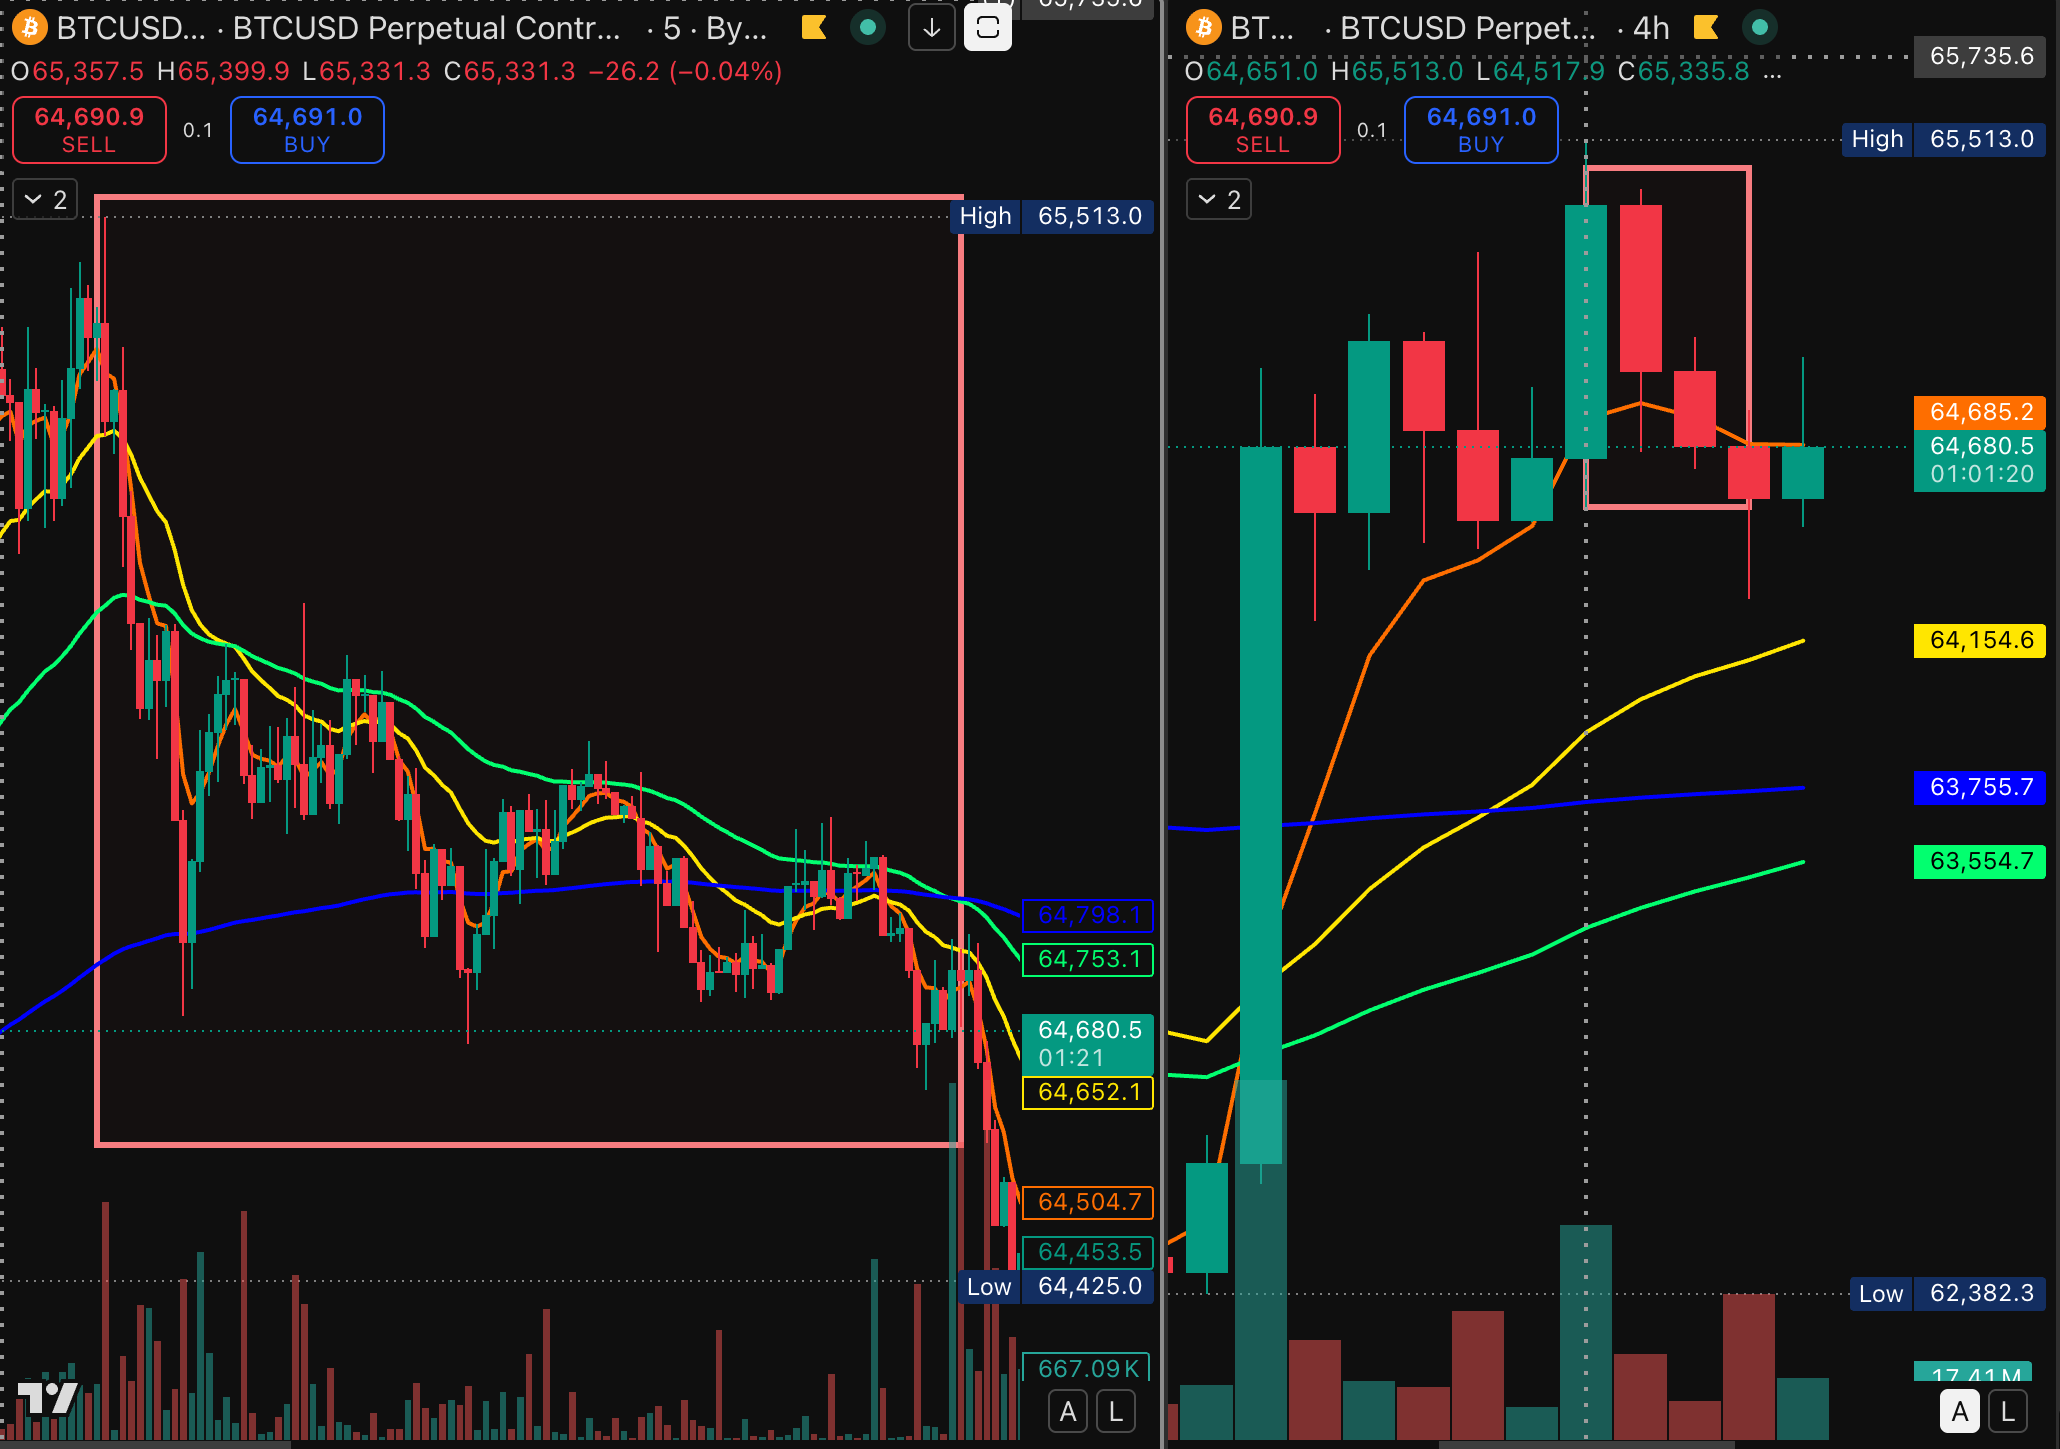
It's like judging your child's entire day based on the last five minutes before bed. If all you saw was the meltdown over the wrong colour cup, you'd think it was a catastrophe. But look at the whole day, it was a lovely day with one tired moment at the end.
That five minute chart is the meltdown. It's real. It's just not the whole story.
The four hour is where the real picture lives. That's where you decide what's actually going on. Then you drop down to a lower timeframe to find a tidy entry. But you never panic out of a perfectly good trade because of what a five minute candle is doing.
3. EMA's: the bench, the bounces, the crossover
EMAs are moving averages. They smooth out all the noise so you can see the actual direction underneath. We use three (the 21, the 55, and the 200) and together they tell a pretty clear story.
Here's how I think about it. Price is a toddler at the playground. It runs off, gets brave, explores. But it always comes back to check in. The EMA is you, sitting on the bench.
Watch what happens when price comes back to those lines. It bounces off them. Again and again. Those bounce points are zones worth watching. They matter.
And when price shoots way out, miles above the line, that's the toddler who's run too far. They always come back.
As price drifts across the park, you pick up your bag and move benches. Wherever you end up is the trend. Line pointing up, uptrend. Pointing down, downtrend. All tangled up and going sideways, the market doesn't know either, or it's consolidating. So we keep an eye on it for a clear direction.
Then there are crossovers. When the shorter EMA crosses over the longer one, on the four-hour or higher, that's a trend actually changing. Not a wobble.
4. Fair value gaps: the step the market skipped
Sometimes price moves so fast it just skips a whole section.
One massive candle, everyone piling in at once, and it leaves a hole behind. That hole is a fair value gap.
Here's how to spot one. Find a big, impulsive candle. Look at the candle before it and the candle after it. If their wicks don't overlap, if there's empty space between them, that gap in the middle is your fair value gap
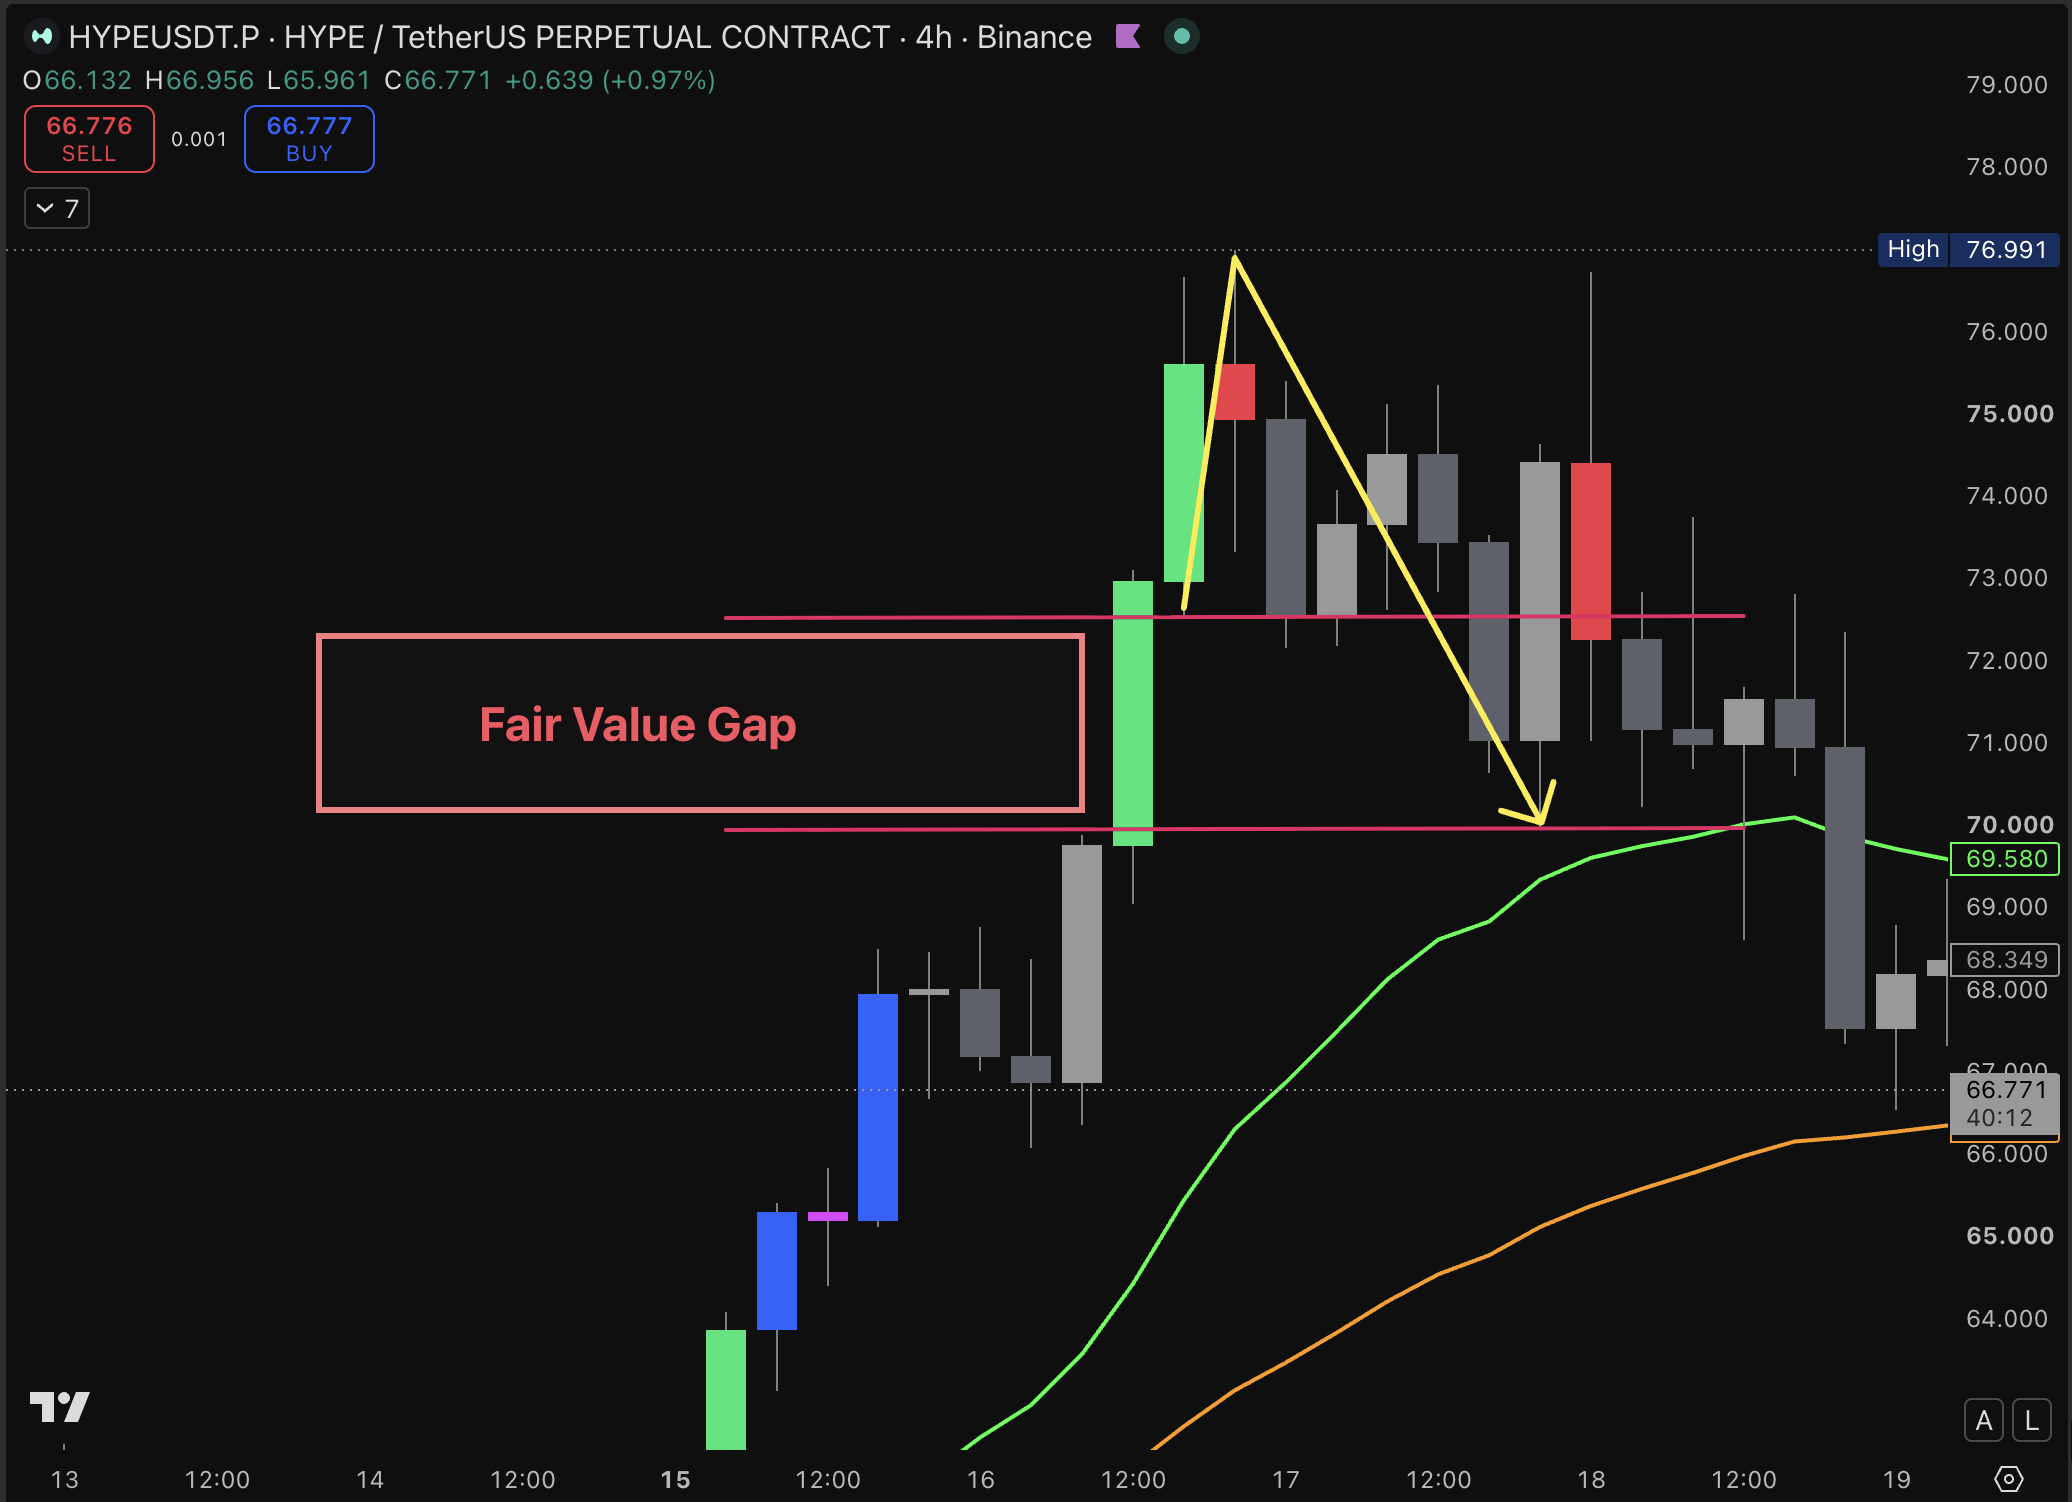
And the market doesn't like unfinished business. It often comes back to fill that space (to do the trading it skipped) because half the market was asleep when it happened. They never got a turn at that price. That's the fair in fair value gap.
Now, often, not always. Nothing on a chart is always.
But when price comes back to that gap and a pin bar shows up right there? Now you've got two things pointing at the same spot. That means something.
This is part of something called smart money concepts, a bigger topic we'll cover properly in a future tutorial.
5. Divergence: when the chart is telling you a lie
We don't trade against the trend. That's a fast way to lose money.
But sometimes a trend is ending. And divergence is the signal that helps you see it coming before it becomes obvious.
Here's what to look for. Price makes a low, bounces, then makes a second low that's lower than the first. Price is telling you it's still falling.
Now look at your momentum indicator, the Stochastic, over the same period. That second bottom is actually higher than the first.
Price is going down. Momentum is going up. They disagree. That's a bullish divergence.
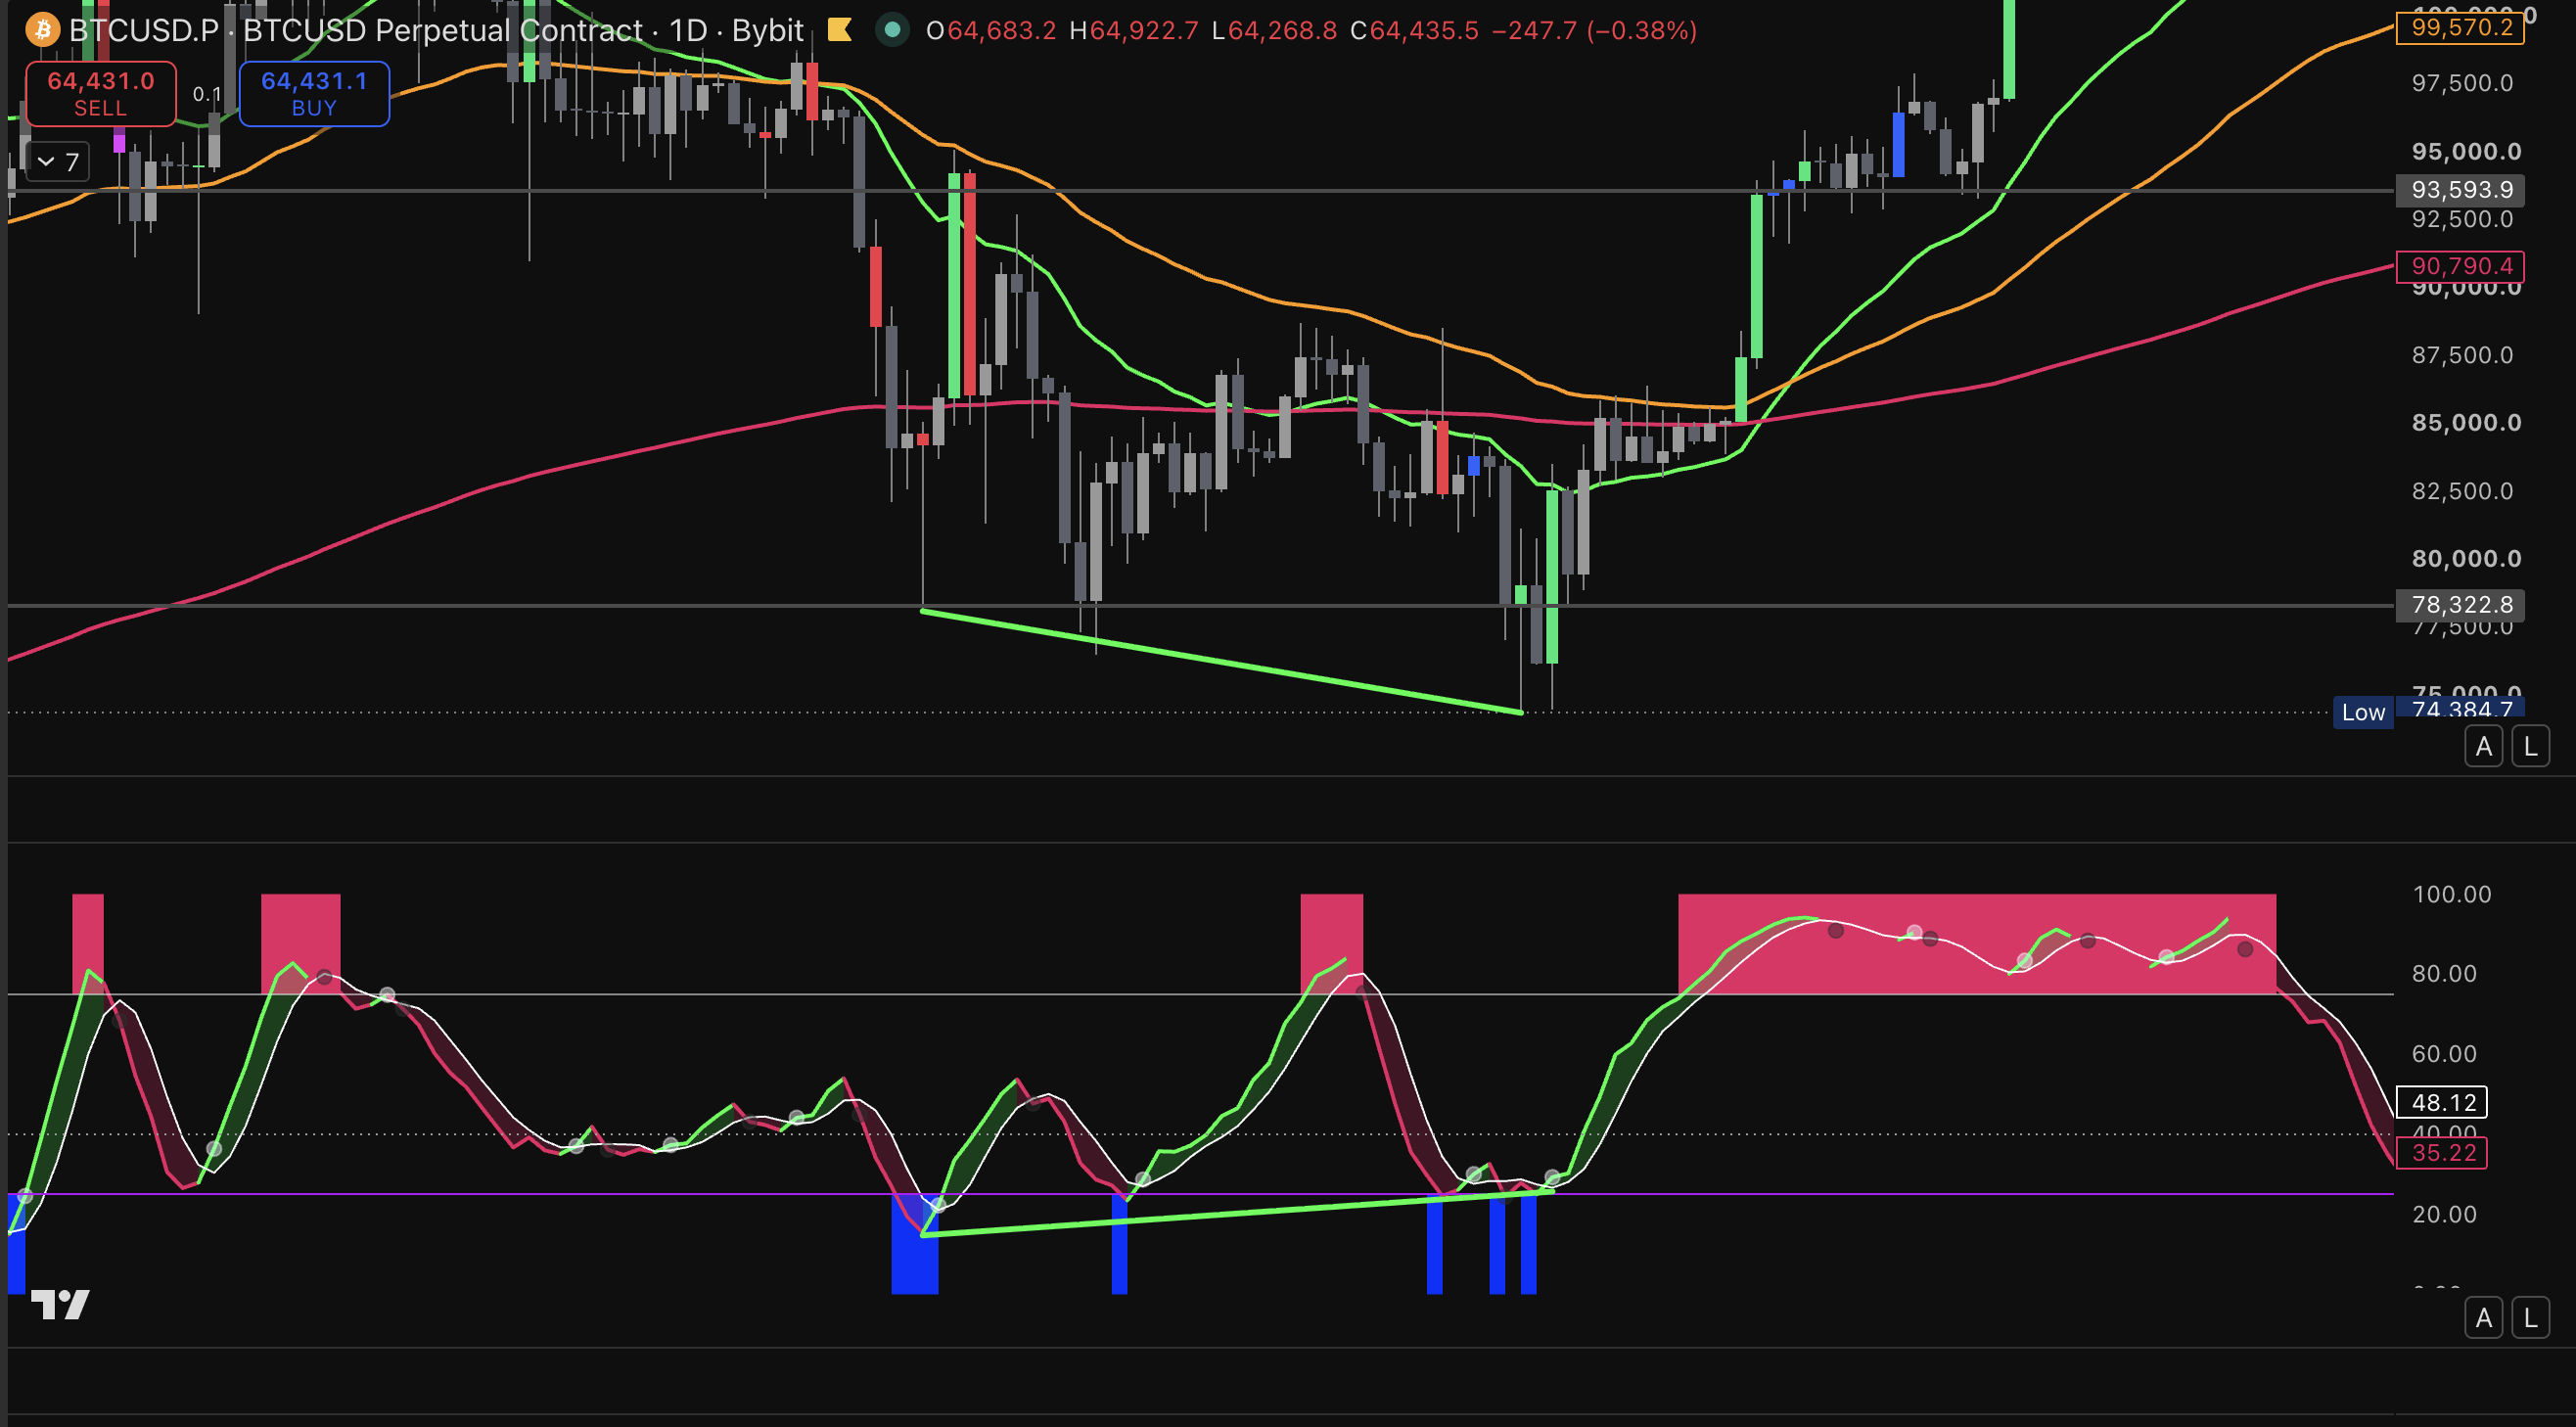
The opposite works for a top, price makes a higher high, momentum makes a lower high. It's the same lie in the other direction. That's bearish divergence.
But this is important: divergence on its own is not a reason to place a trade. It's a heads up. It's the signal that makes you go and draw your Fibonacci, check your levels, pull up your Risk/Reward tool, and actually work out whether the trade is worth taking.
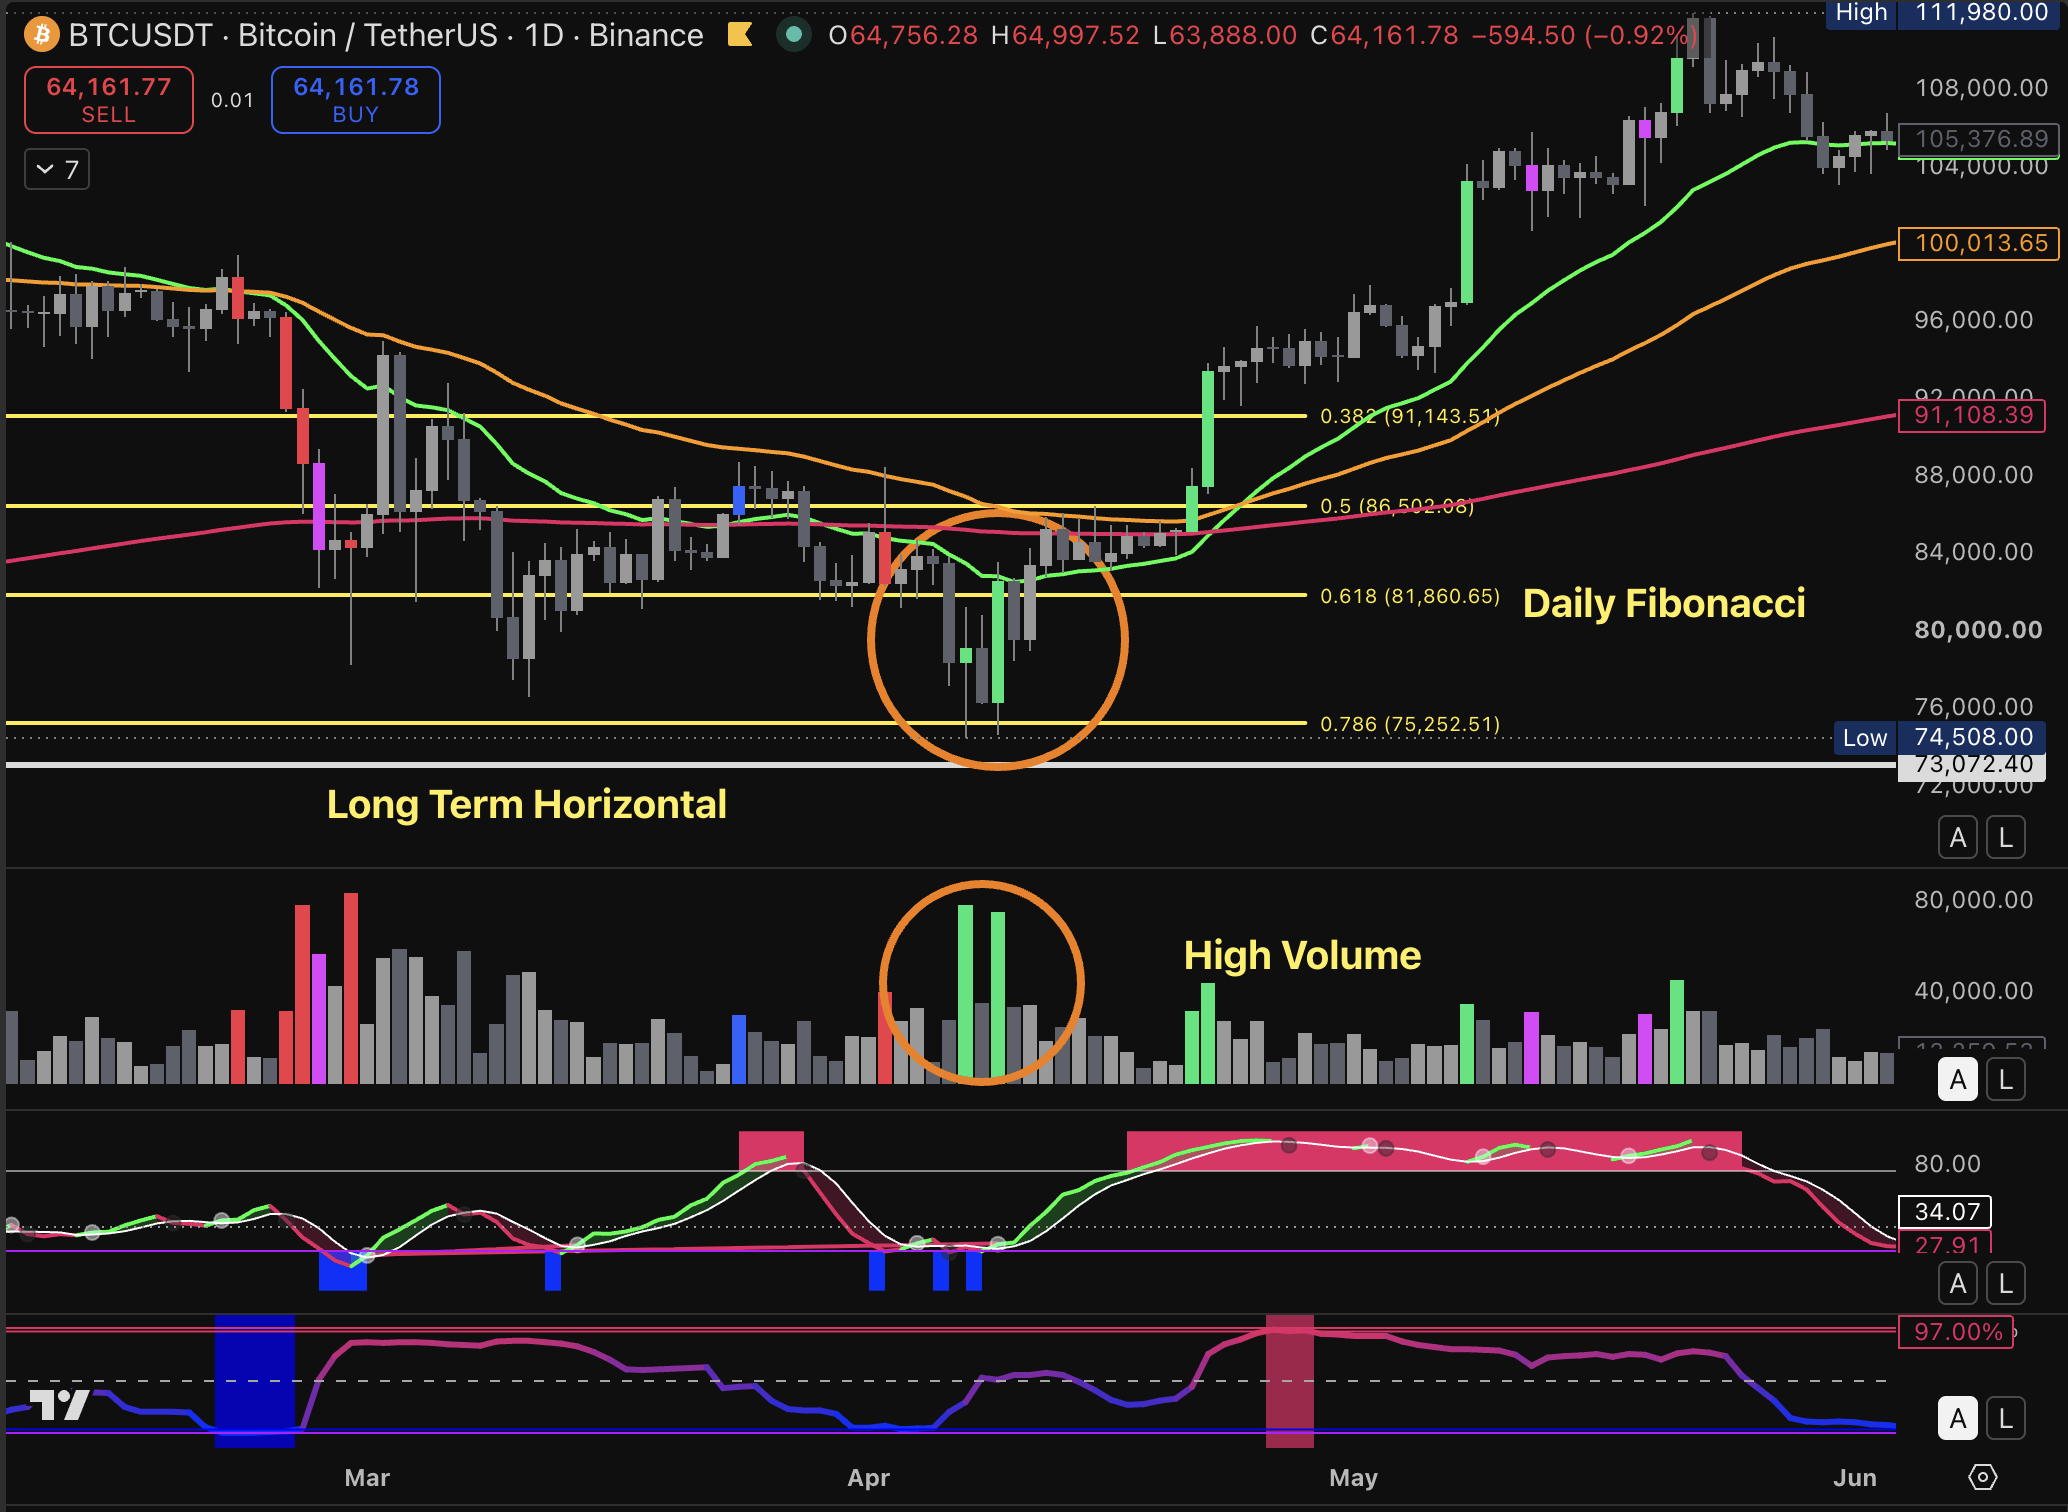
Then you confirm it with everything else. A divergence that lines up with a key level, a standout candle, and volume behind it. Now you have something worth paying attention to.
They're not looking for one perfect signal. They're stacking things. Levels plus candles plus volume plus momentum. When four things are all pointing at the same spot at the same time, that's when you lean in.
Don't try to use all five tomorrow. Open one chart today and just find the bodies, write down your levels. Build it one layer at a time.
And if you've ever been made to feel like this world isn't for you, it is. There are thousands of moms doing this together, one skill at a time.
You've got this. 💚 Mel
Frequently Asked
What is a bullish engulfing candle? A bullish engulfing is when one candle completely swallows the candle before it. The bigger and more dramatic the swallow, the stronger the signal. It means the buyers just took over the argument in one move.
What is a pin bar in trading? A pin bar is a candle with a tiny body and one long wick. Price shot in one direction, got rejected, and came back. On its own it's noise. Sitting on a key level, it's a signal worth watching.
What is a fair value gap (FVG)? A fair value gap is a space on the chart where price moved so fast it skipped a whole section. Spot it by looking at a big impulsive candle and checking if the wicks of the candles before and after it don't overlap. That empty middle is the gap, and price often comes back to fill it.
What is bullish divergence? Bullish divergence is when price makes a lower low but your momentum indicator (like the Stochastic) makes a higher low over the same period. Price is going down, momentum is going up. They disagree, and that disagreement often signals a trend is running out of steam.
Why do EMAs (moving averages) matter? EMAs smooth out the noise so you can see the actual trend underneath the candles. Price returns to them like a toddler checking back in with the bench. Their direction tells you the trend, and their crossovers on higher timeframes can flag a real change of direction.
This content is for educational purposes only. Always do your own research before making any trading decisions.