Lesson 08 | How to Trade Volatility
You can read a chart perfectly. You can have the trend right, the Fibonacci right, the EMAs lined up, and still lose the trade.
Not because your analysis was wrong. Because your timing was off.
I've been there. You enter a trade that looks perfect on paper, and then price just... sits there. Or worse, it drops before eventually going exactly where you predicted. You were right. Just early. And in trading, early is the same as wrong.
Today we are looking at an indicator that helps us bridge that gap, and it's called the BBWP. But before we can understand how the BBWP works, we need to understand Bollinger Bands first and how they help us with market volatility.
First, what is volatility?
Volatility isn't direction. This is really important. It doesn't tell you whether the market is going up or down; your trend and your EMAs do that.
Volatility tells you when things are about to move, and how hard.
Here's a simple way to think about it. Imagine a pressure cooker on the stove. When the lid is on and the pressure is building, everything looks quiet from the outside. Nothing is happening. And then, release. Suddenly, everything moves at once.
The market does this constantly, long quiet periods followed by sudden, powerful moves. BBWP shows you when the pressure is building, before the release.
What are Bollinger Bands?
If you've spent any time in trading groups or watched YouTube traders talk about volatility, you've probably heard about Bollinger Bands. They're one of the most widely used tools in trading, and chances are someone has already told you to add them to your chart.
Here's what they actually are.
Bollinger Bands are three lines that wrap around your candles. A middle line, which is simply a moving average of recent price, and then an upper and lower band that expand and contract depending on how much price is moving.
When the market is calm and not doing much, the bands squeeze together tightly. When the market starts moving with energy, the bands widen out. The idea is that when the bands are really squeezed together, a big move is coming. And when the bands are wide, the move is already happening.
Simple enough in theory. The problem is in practice.
The moment you add Bollinger Bands to a chart that already has your EMAs, your Fibonacci levels, and your Trend Line, the screen turns into a mess of overlapping lines. Three more lines wrapping around your candles, moving constantly, crossing your other tools. It becomes harder to read, not easier.
And trading off the bands themselves can be just as confusing. Price can ride the upper band for a long time before reversing. It can touch the lower band and keep going. The squeeze can last for weeks before anything happens. As a beginner, trying to make decisions off those signals adds noise, not clarity.
This is where the BBWP comes in
BBWP stands for Bollinger Band Width Percentile. You don't need to memorise that. What you need to know is this:
It measures how quiet or active the market is right now compared to its own recent history. Is it building energy, or already spent?
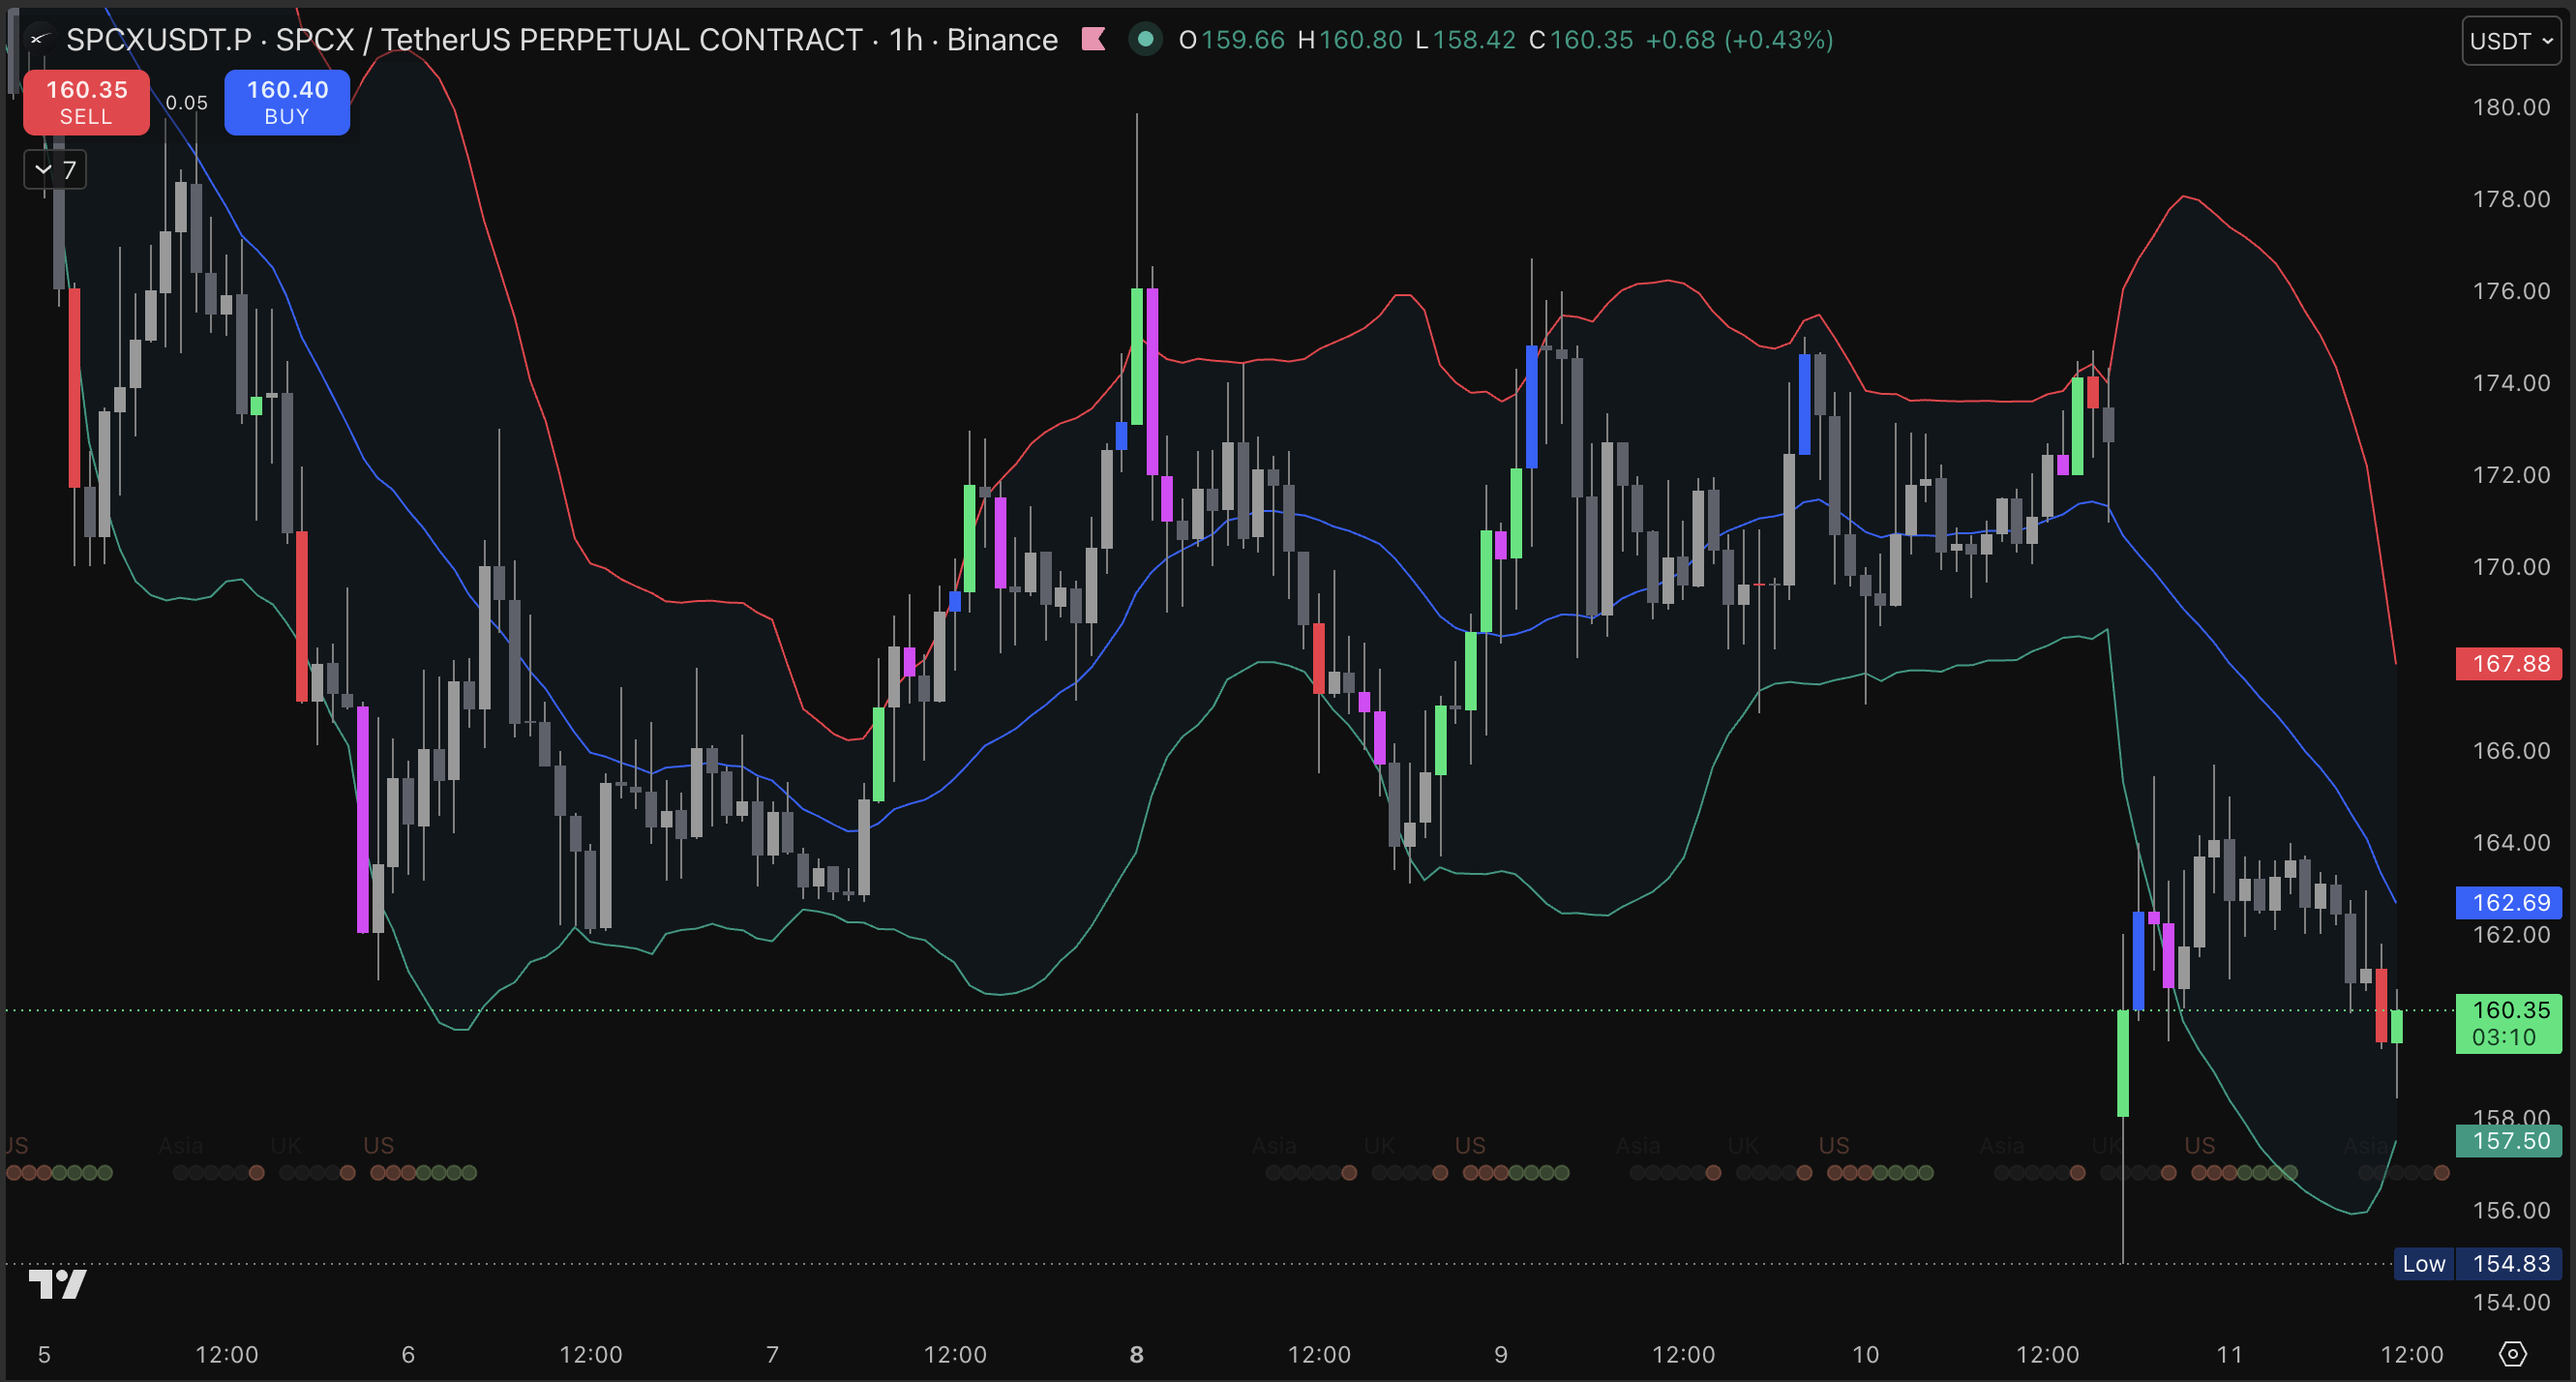
How to add it to TradingView
Search for BBWP by The Caretaker in the Indicators bar. It's free. Add it to your chart, and it will sit as a panel below your candles, similar to your Stochastic.
Once it's added, open the settings and check these numbers:
- Basis moving average length: 21
- Lookback period: 150
- MA type: SMA
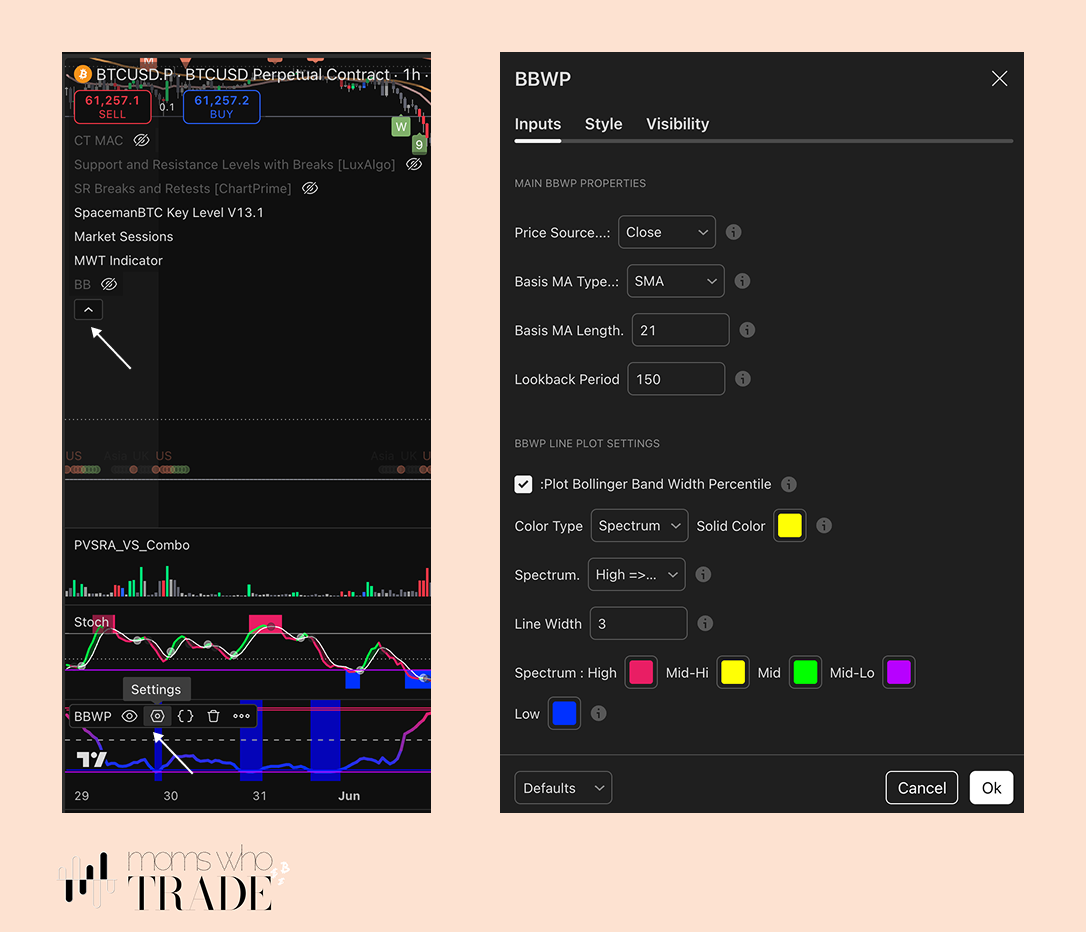
That's it. You're set up.
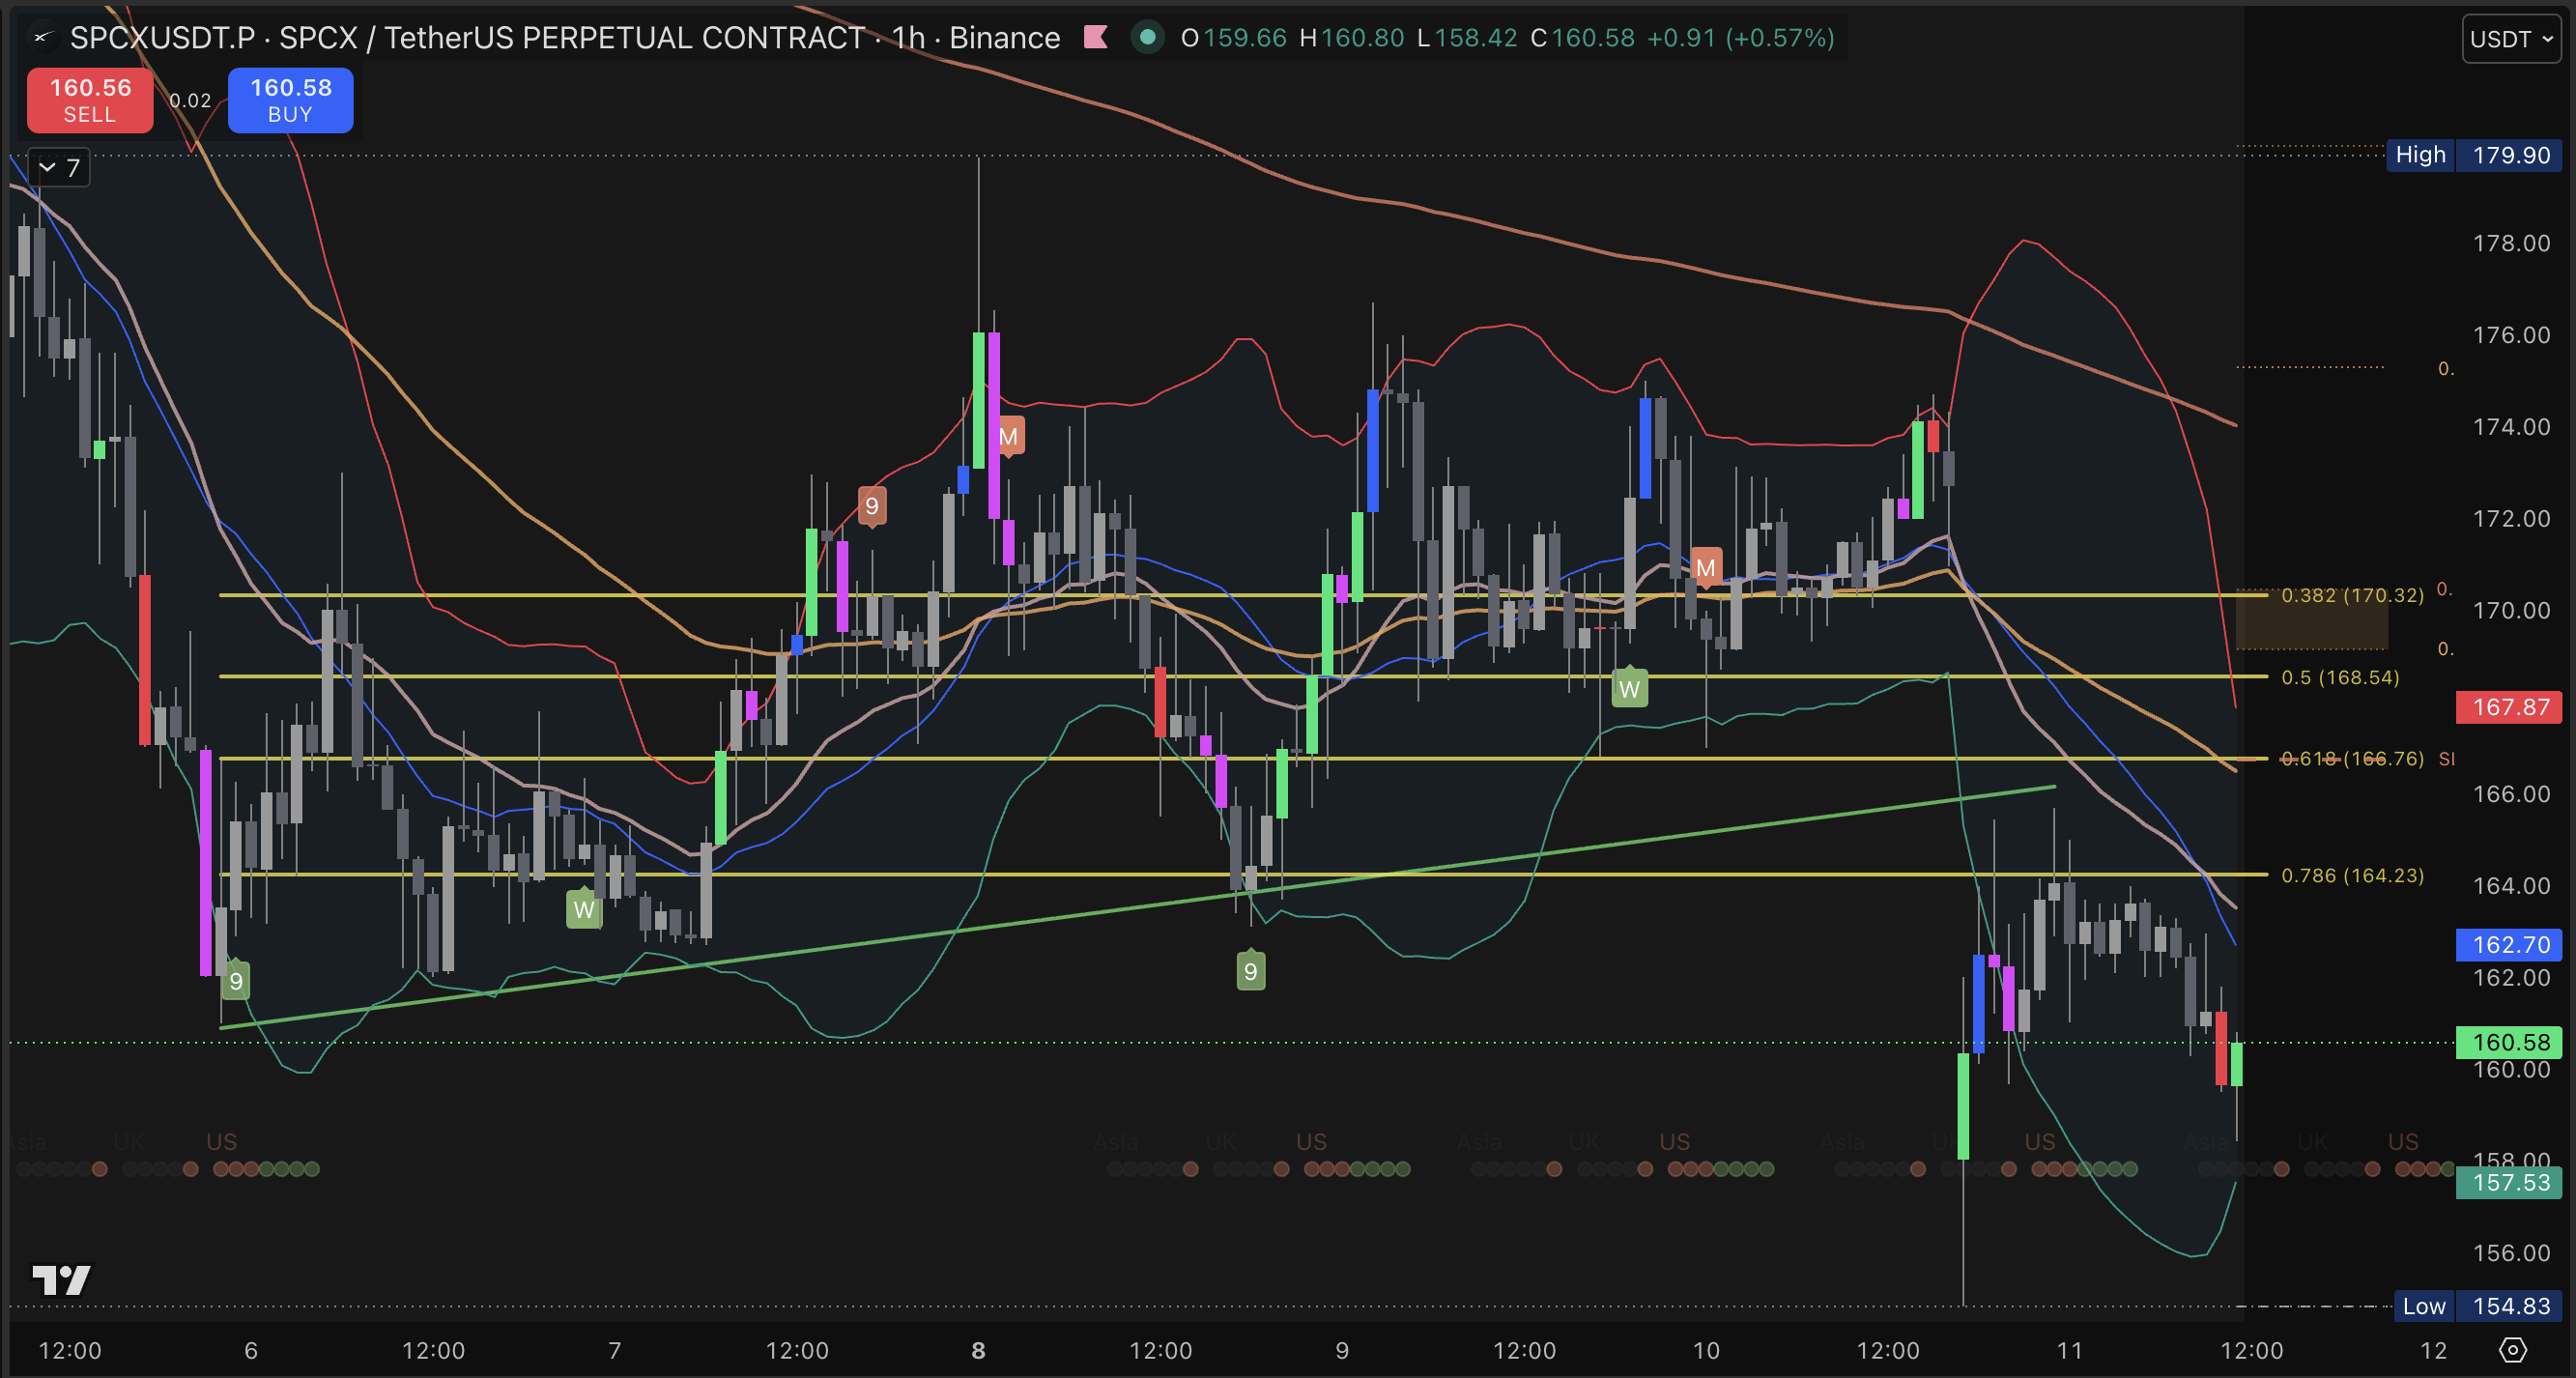
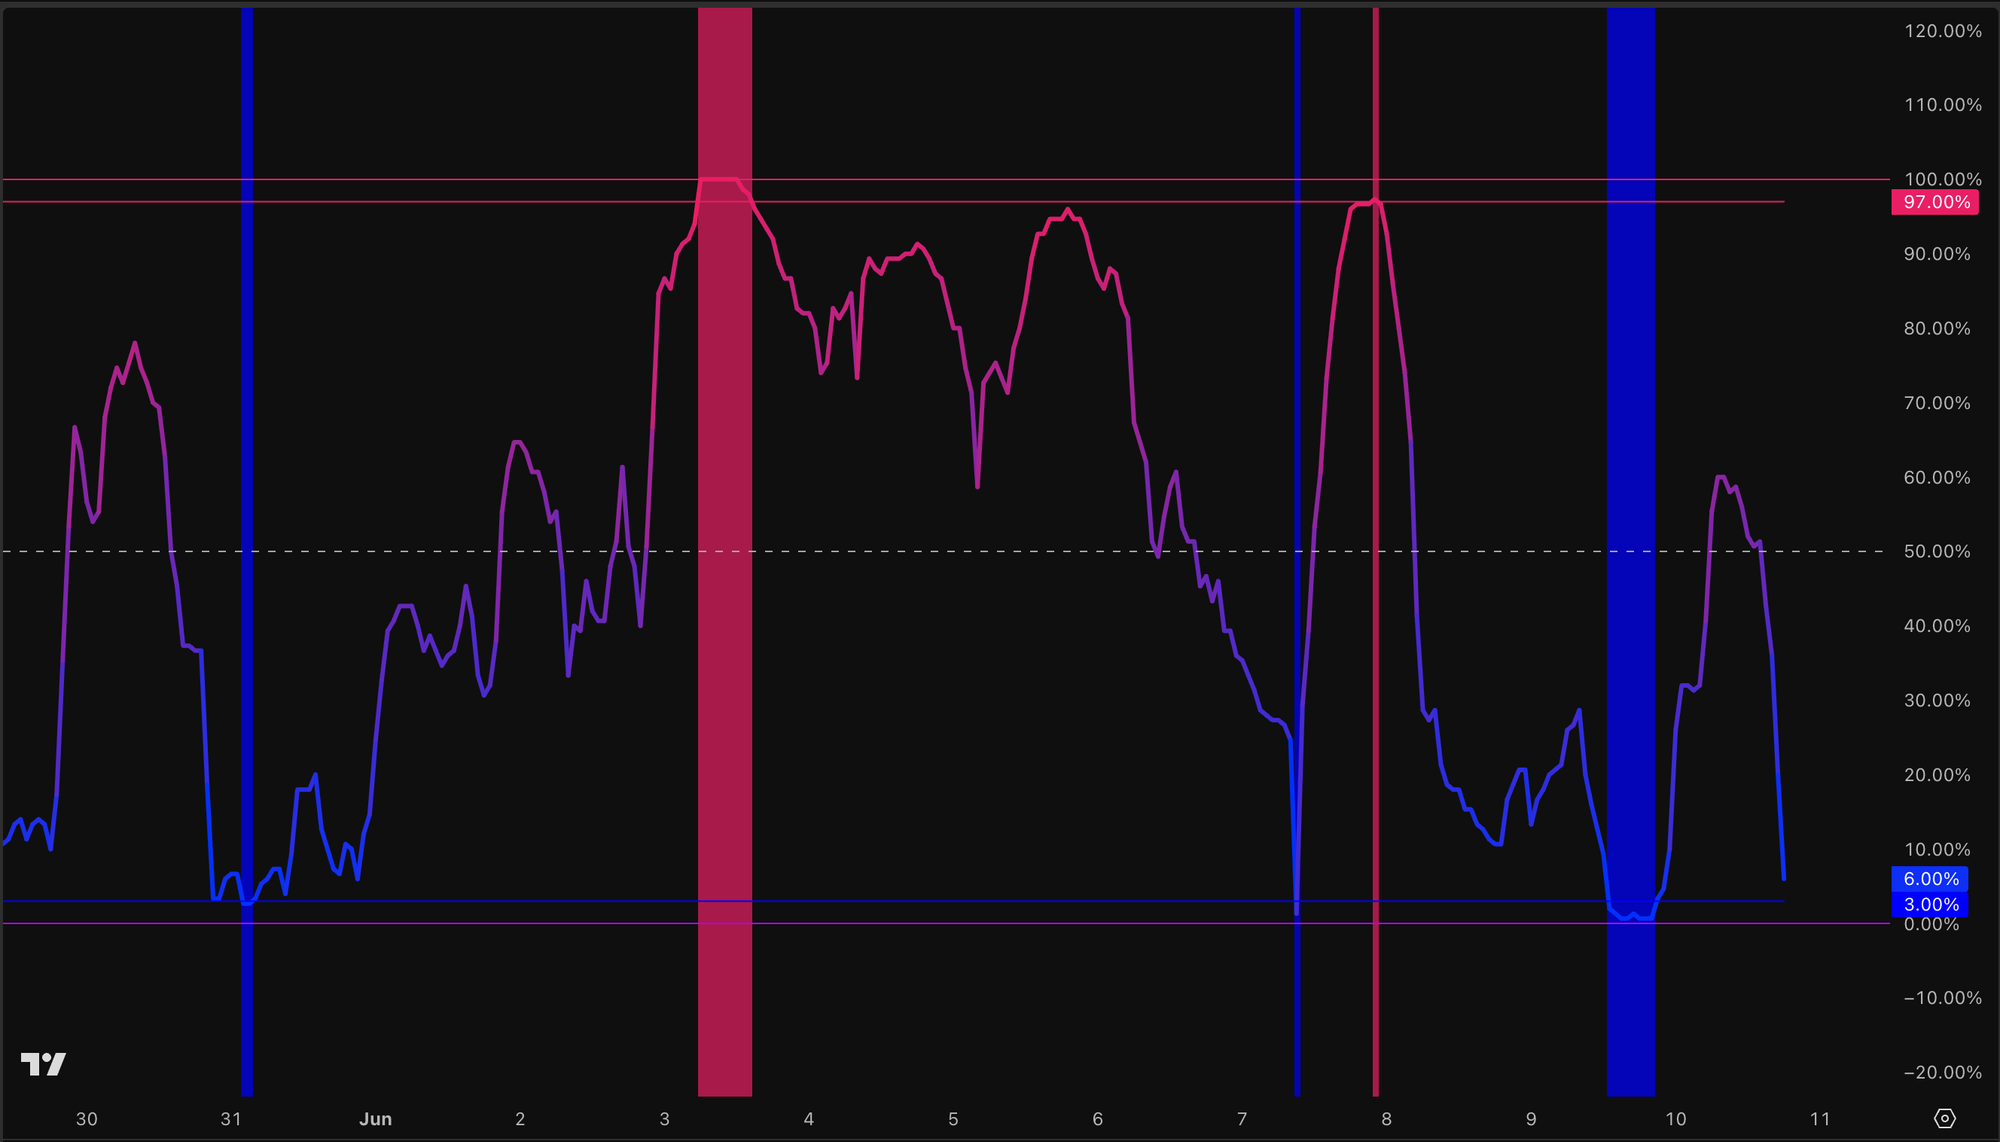
Blue bars and red bars: Here's what they mean
Blue bars
Blue bars mean the market is quiet. Volatility is low. Price is barely moving.I know, that sounds boring. But this is actually what you're looking for.
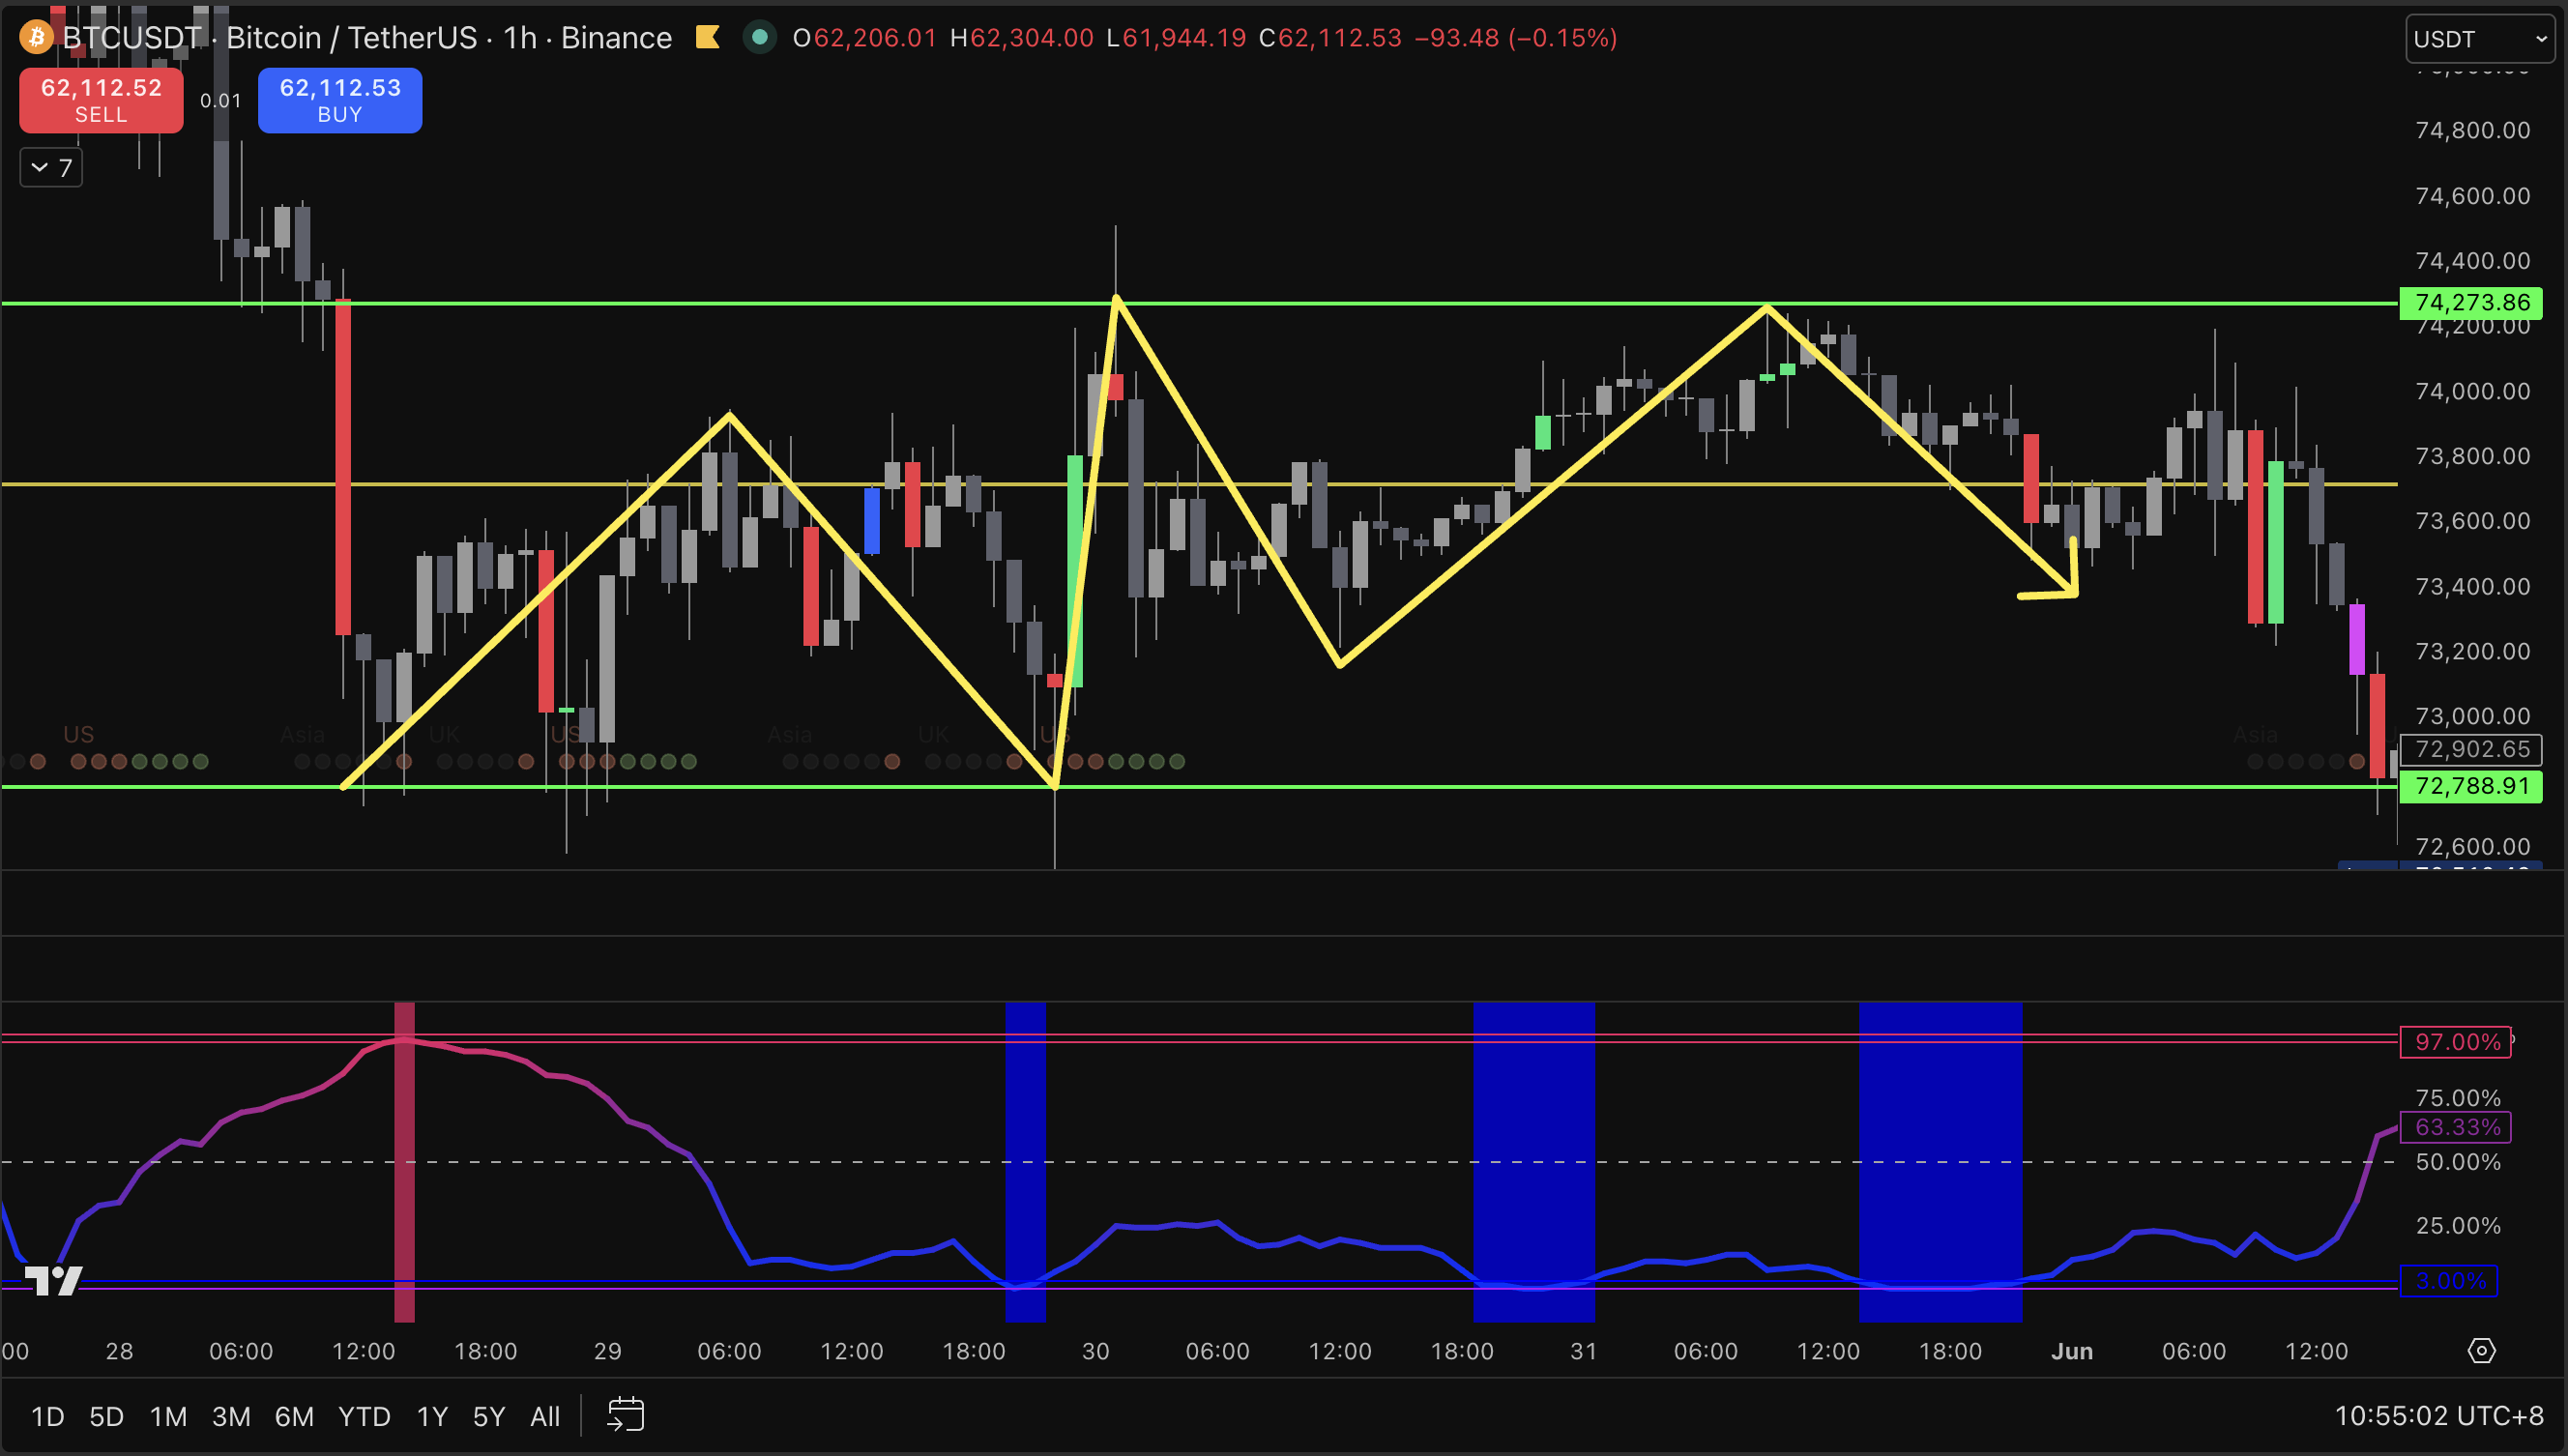
Low volatility always comes before high volatility. Always. It's not a maybe; it's a rule. Those blue bars are the market loading energy. The longer and more recent the blue bars, the more pressure has been building.
Think of it like a coiled spring. The tighter it's compressed, the bigger the release when it finally goes.
Red bars
Red bars mean the market is already moving. Volatility has expanded. The energy is being released right now.
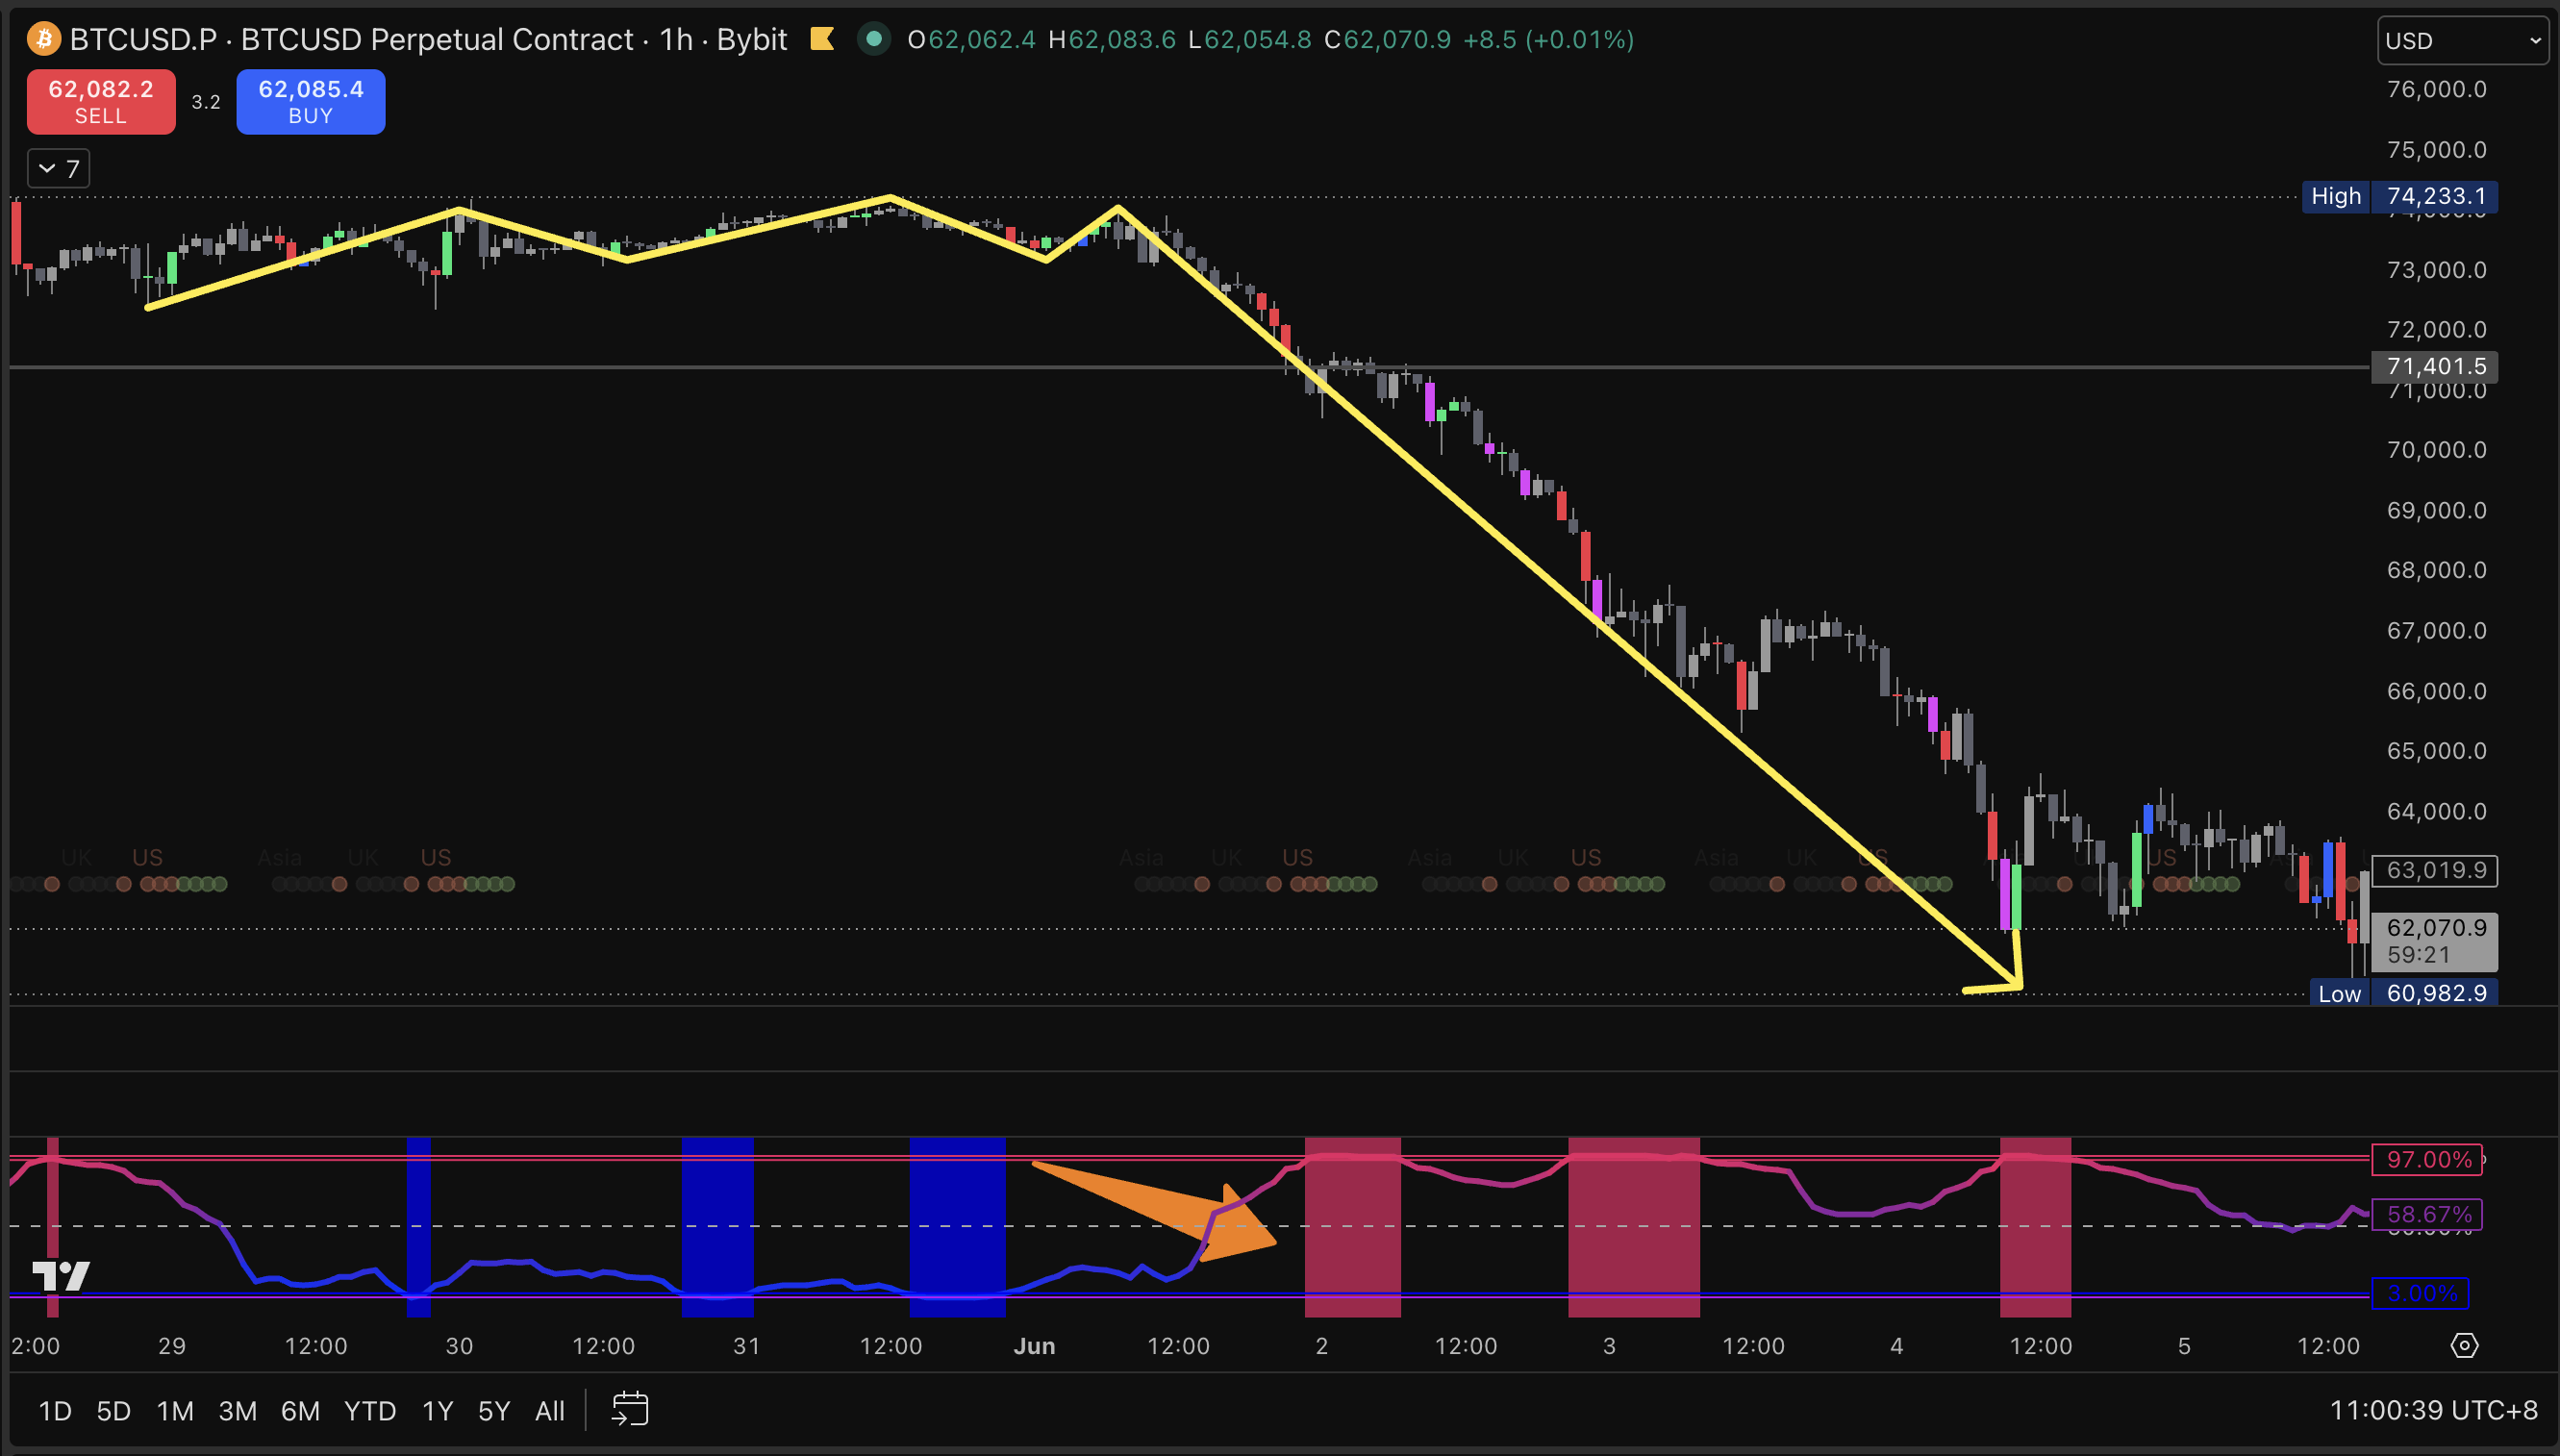
Here's the thing: if you're only noticing a trade because you see big red bars and a massive candle, you're late. The move has already started. Jumping in at this point is like arriving at a party at 2 a.m. Technically still a party, but you've missed most of it.
As a beginner, blue bars are your signal to pay attention. Red bars are your signal to be cautious.
The line running through the bars
The moving average line tells you the trend of volatility itself. Is the market getting calmer or more active over time?
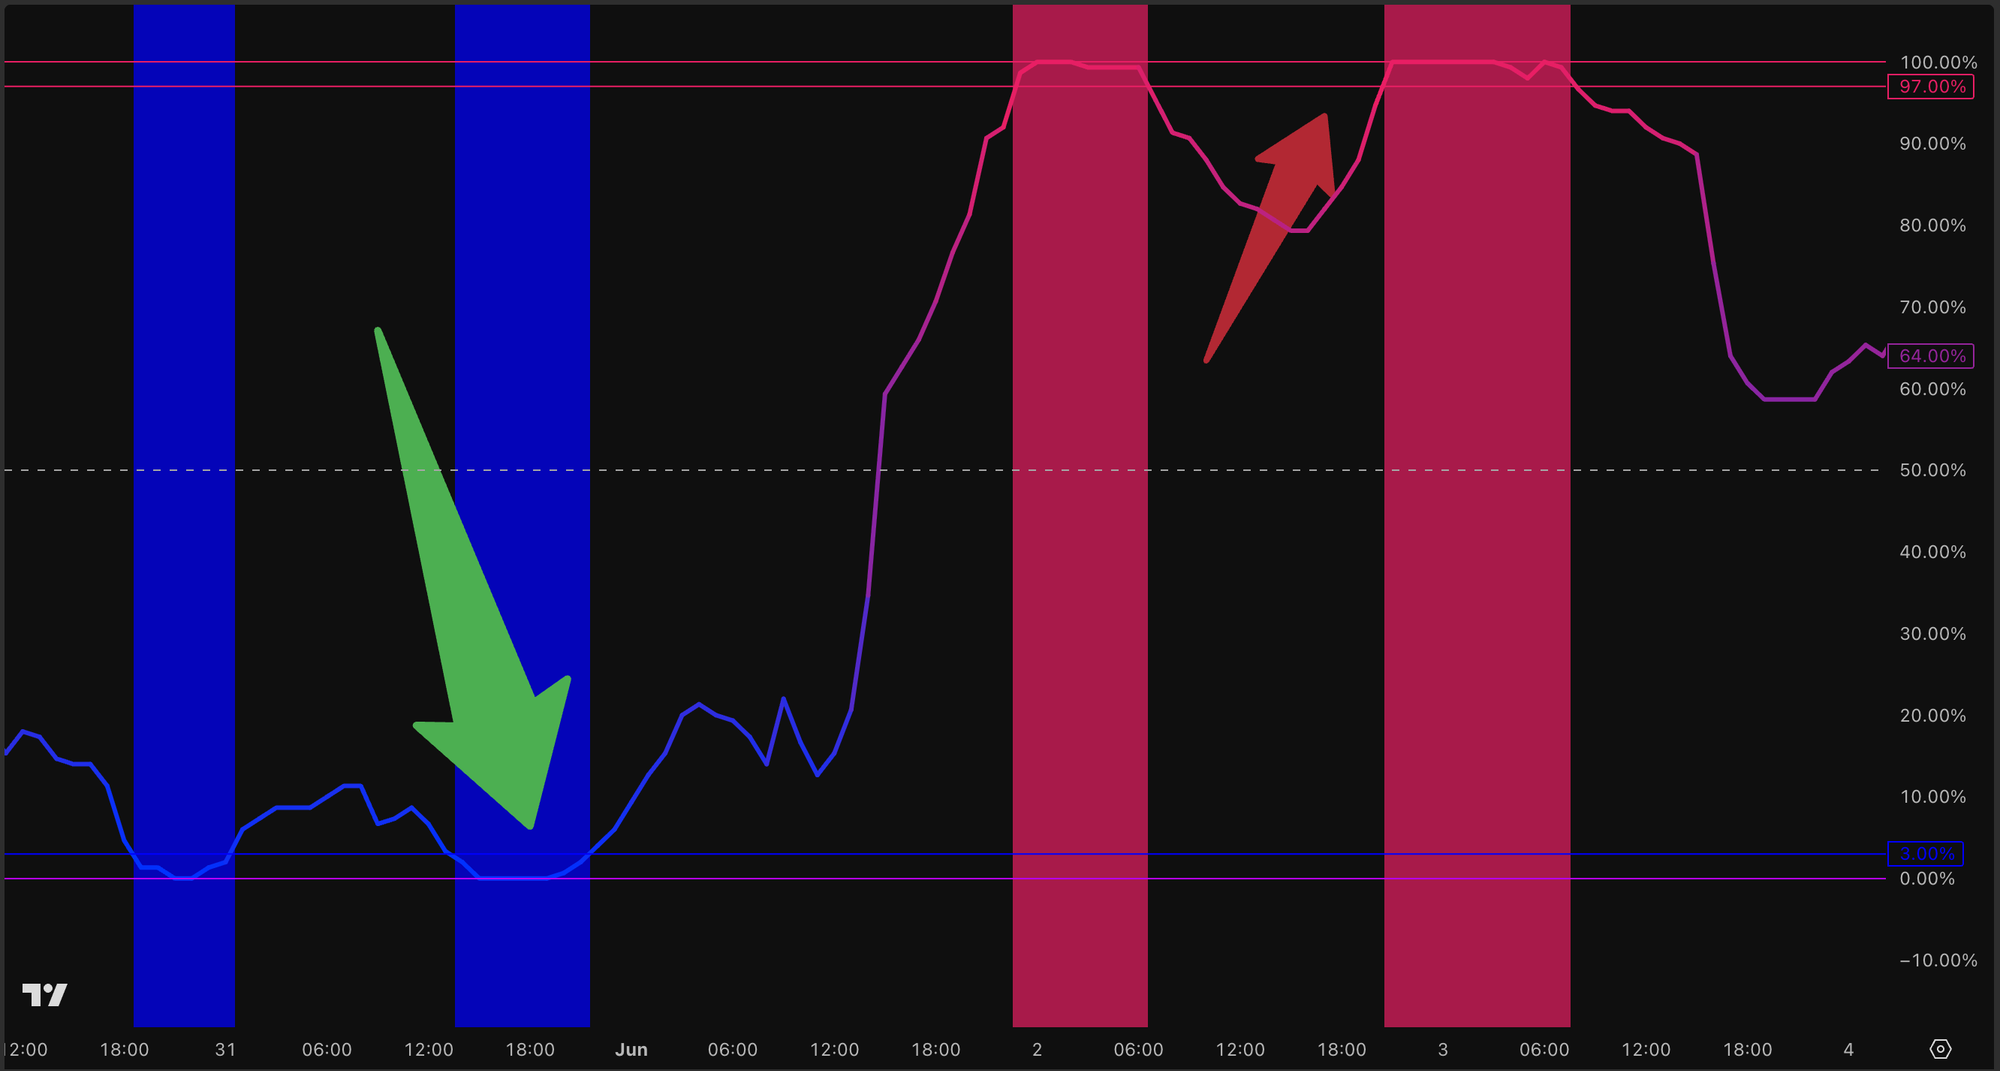
What you want: the line sloping downward or sitting flat and low. Volatility has been quiet for a while. The spring is coiled.
What you don't want: the line rising sharply. The move is already underway. You may be late.
The trap most beginners fall into
This one I want you to really take in.
By the time something is all over Instagram, by the time everyone is talking about a coin or a stock going crazy, you are almost certainly looking at the top of the expansion. The big move has already happened. The people who made money got in during the quiet. The people who FOMO in after the noise? They often get caught holding the bag.
BBWP protects you from this. Instead of watching social media for trade ideas, you watch your chart for compression. When things are quiet and blue bars are building, that's when you lean in. Not after the candle. Before it.
Why do your other indicators sometimes let you down
You've noticed by now that sometimes your Stochastic gives a signal and nothing happens. Price chops around, goes nowhere, and you get stopped out before it eventually moves.
This isn't the indicator failing. It's the indicator being used in the wrong environment.
During low volatility - when BBWP is showing blue bars - momentum signals don't follow through reliably. The market is consolidating, not trending. Your Stochastic isn't designed for that.
The fix is simple: always check BBWP first. If blue bars are showing and the line is low...be patient. Wait for the expansion to begin. Once volatility starts to pick up from a compressed base, your other indicators become much more trustworthy.
How I use BBWP before every trade
By the time I'm ready to think about an entry, I've already checked my trend, my Fibonacci levels, my EMAs, and my Stochastic. The setup looks good.
Then I check BBWP and ask three things:
Blue bars in the last 24 hours? Yes, the market is still compressed. The move likely hasn't happened yet.
Is the line sloping down or sitting low? Yes, compression confirmed. Energy is building.
Is BBWP reading below 35? Below 35 is our sweet spot. Volatility is genuinely low, and a move is loading.
All three pointing the same way, that's a green light on timing. Not a guarantee. But confirmation that right now is worth paying attention to.
BBWP also tells you when to get out
This is the part most people miss.
When BBWP bars start turning red and the line pushes above 80, the expansion is done. The energy has been fully released. The move is mostly over.
This is your cue to start your exit. Take profits. Tighten your stop. Think about partials.
The trampoline has reached the top of its bounce. It's coming back down. The traders who win consistently take their money near the top, not on the way back down, hoping for a little more.
BBWP above 80 = start thinking about your exit.
How it all fits together
BBWP is the final layer on top of everything you've already learned:
- Trend and EMAs - which direction
- Fibonacci - which level
- Stochastic - is momentum turning
- BBWP - is the timing right
A setup can tick every box - but if BBWP is showing red bars and a rising line, you wait. The next compression will come. There is always another trade.
A setup that ticks every box AND shows blue bars with a low declining line, that is a setup worth taking seriously.
Mom Tip: Waiting is not missing out. Blue bars are your permission to be patient. The market is loading, and your job is to be ready when it goes, not to chase it after it already has.
This lesson is for educational purposes only. Always do your own research before making any trading decisions.