Lesson 06 | Plan Your First Trade

First things first: what are you working with?
Phone only? Perfect. You do not need a fancy dual-monitor setup or a dedicated trading laptop to start. Plenty of moms in our community trade entirely from their phones. Whatever device you have open right now, that's enough.
Where does trading actually happen?
Trading happens on exchanges. Think of an exchange as the marketplace where buyers and sellers meet; it's where the actual transaction takes place when you buy or sell an asset.
When you're trading with real money, you'd typically be doing that on one of three types:
A stock or futures broker account - for trading stocks and commodities like gold, silver, or oil.
A centralised crypto exchange - platforms like Binance or Bybit. These are the big-name stores. Easy to use, customer support available, great for getting started with crypto.
A decentralised exchange - like Hyperliquid, which is what we use to trade. No middleman, lower fees, and you stay in control of your funds. The cool part, you can trade almost anything on it. Stocks, commodities, forex, and crypto. All using crypto. More on this in a later lesson.
For now though, you don't need any of that.
TradingView has everything you need to get started - even on the free version.
- The asset or symbol you want to trade
- The charts and tools to analyse and make decisions
- A built-in paper trading function where you get a demo account loaded with monopoly money - while trading on a real chart with real prices and real results
That last point is what makes it so powerful for beginners. You're not simulating a fake market. You're practicing on the real one, risk free.
NOW LET'S PLAN: Before you even think about placing a trade
In Lesson 05 we got our TradingView all set up. Now we need to talk about what you're actually looking for before you touch the buy button. Think of these as your guides, they tell you whether a trade is worth taking and whether the timing is right.
Eventually, you will build your own custom checklist to run through before you take any trades. For now, this is a run-through of our most used ones.
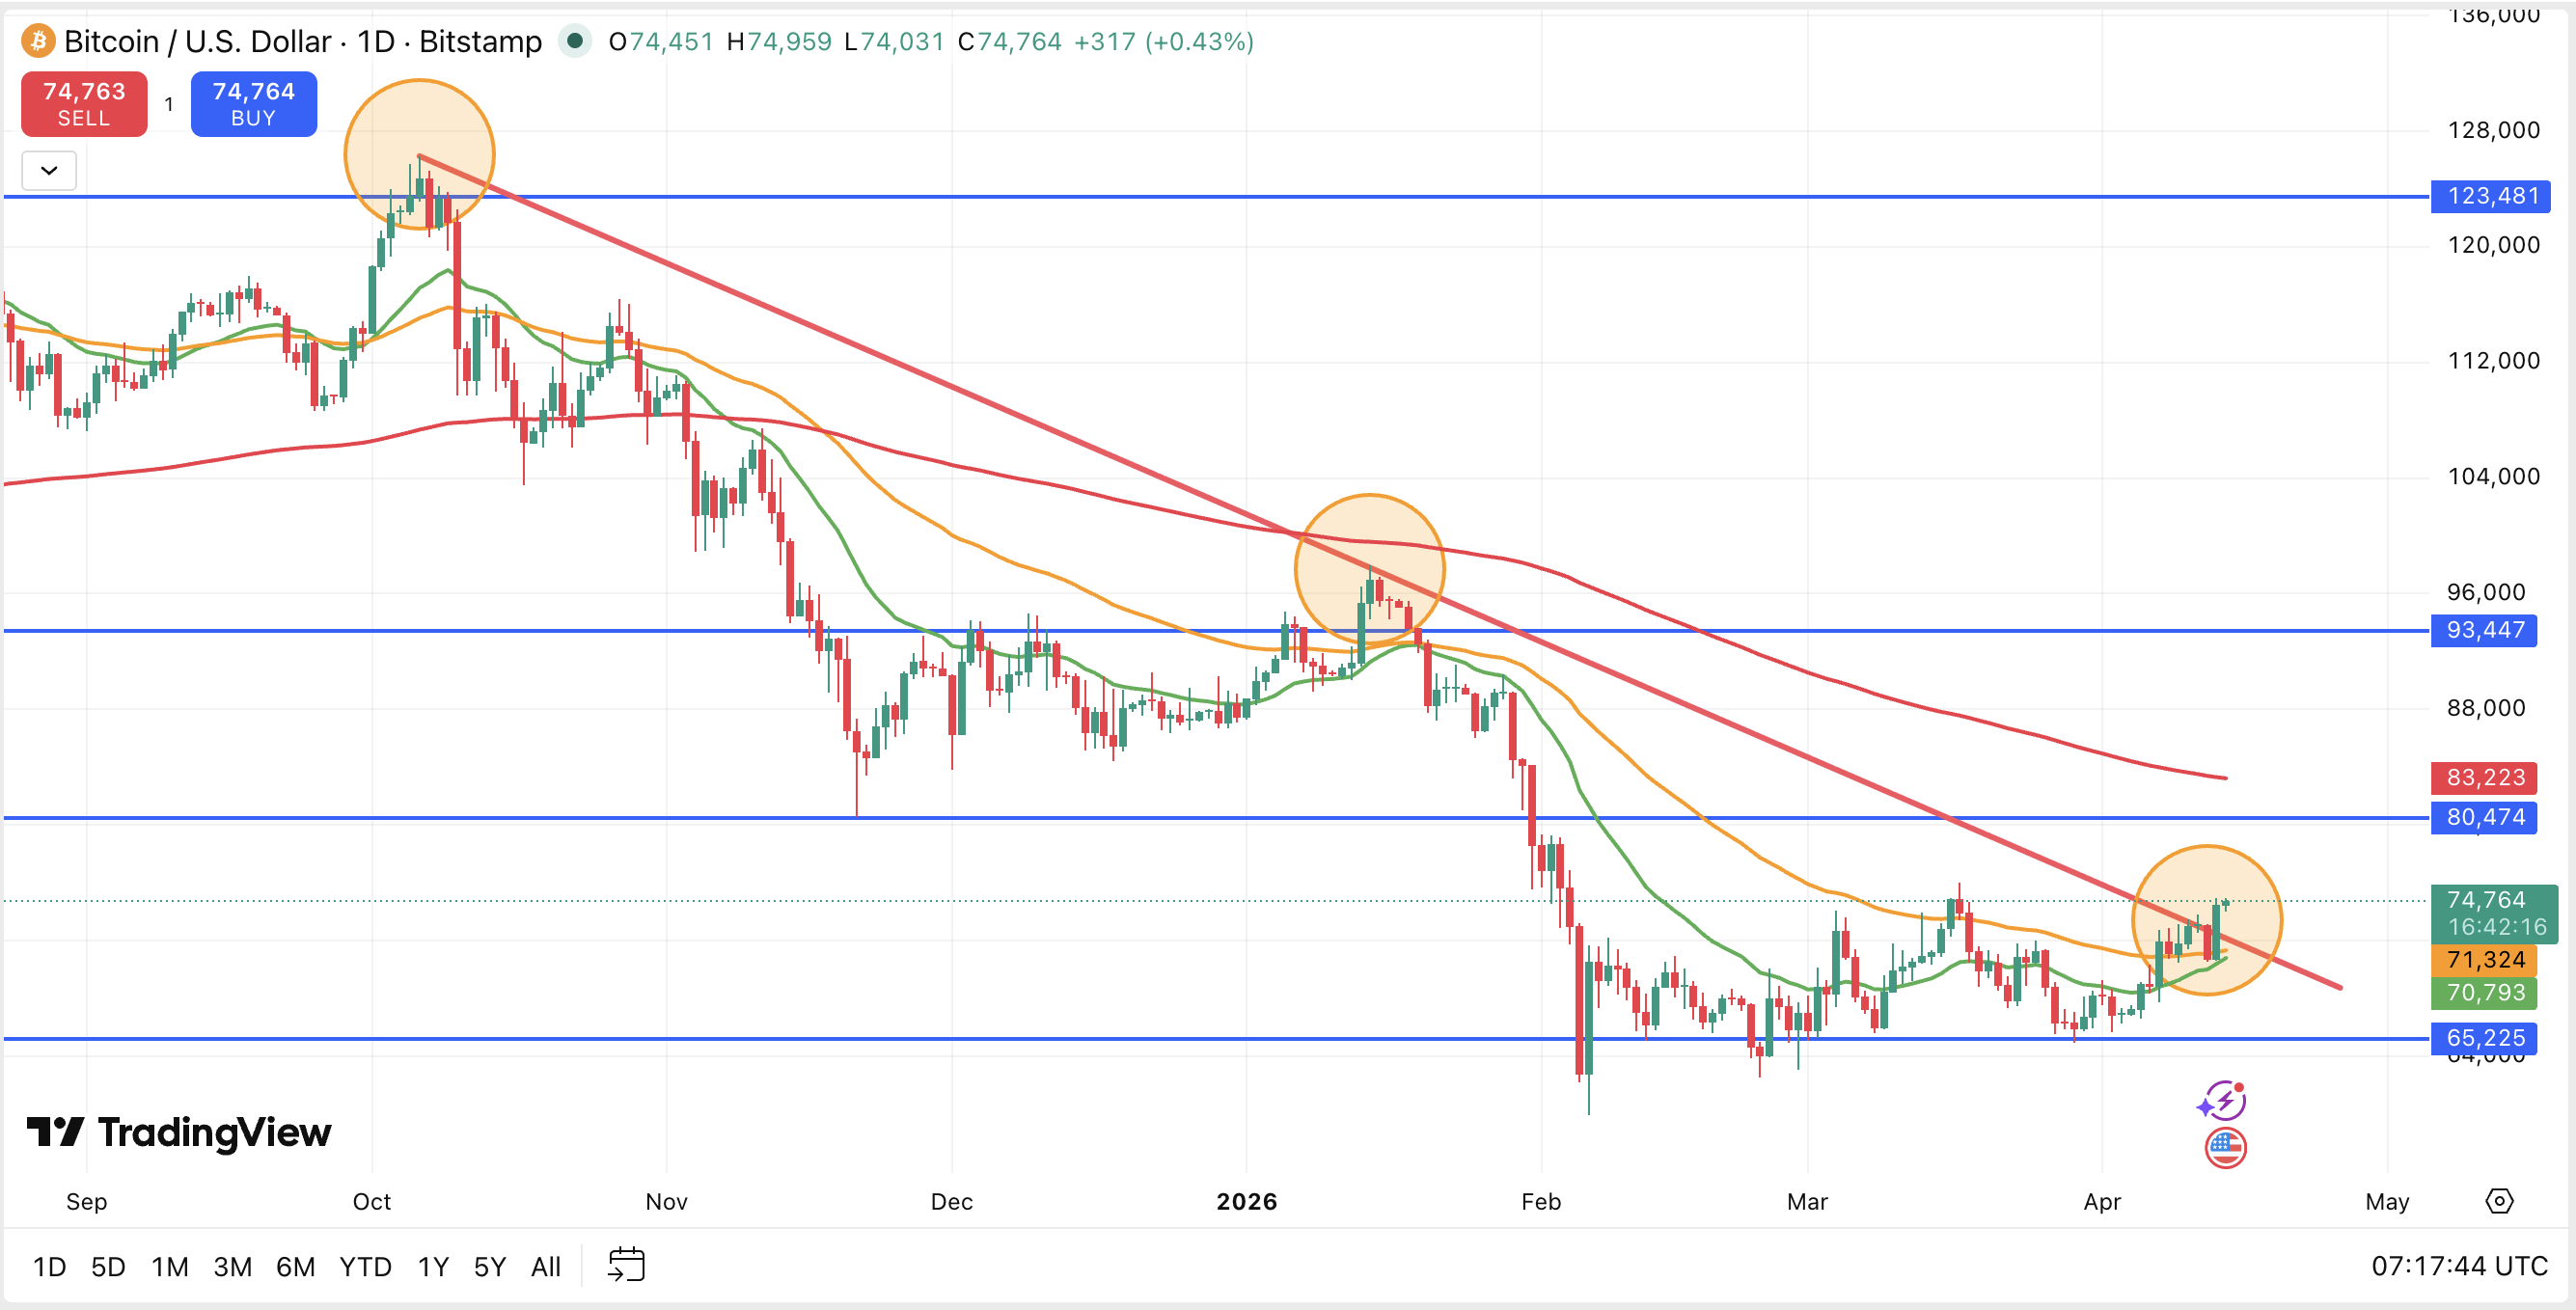
Support and Resistance
Start on the Weekly or Monthly timeframe. We go this big first to filter out the noise and find the levels that really matter.
You're looking for two things.
First, find where price abruptly stopped going up and reversed - look for candles grouped at major peaks, using the close of the candle as your marker. That's your resistance.
Then find the same formations at the bottom - where price stopped falling and turned around. That's your support.
These lines highlight the key zones that the asset reacts to, and keeps coming back to, almost magnetically. Price is always doing one of two things: trying to gain a level or losing one. This is where you hear the terms Bulls and Bears. Bullish means buyers are pushing price toward a higher level - going "long". Bearish means sellers are pushing it down - or going "short".
Drop down to the Daily timeframe once your key levels are marked.
Trend line on the Daily
To draw a trend line, "respect" as many candle bodies as possible - this means you are trying to draw a line that rests on the outside edge of the solid body part of the candles (specifically the groups of higher spikes in this instance).
We connect the lows in an uptrend, and the highs in a downtrend. The more solid candle bodies your line touches, the more reliable and useful it becomes.
Fibonacci on the Daily
Drop down to the Daily timeframe. You're now zoomed into the area where price was sitting on the floor level you marked on the Weekly with the horizontal line.
We will start by looking at price retracing downwards, then switch to where price might extend to if it goes upwards.
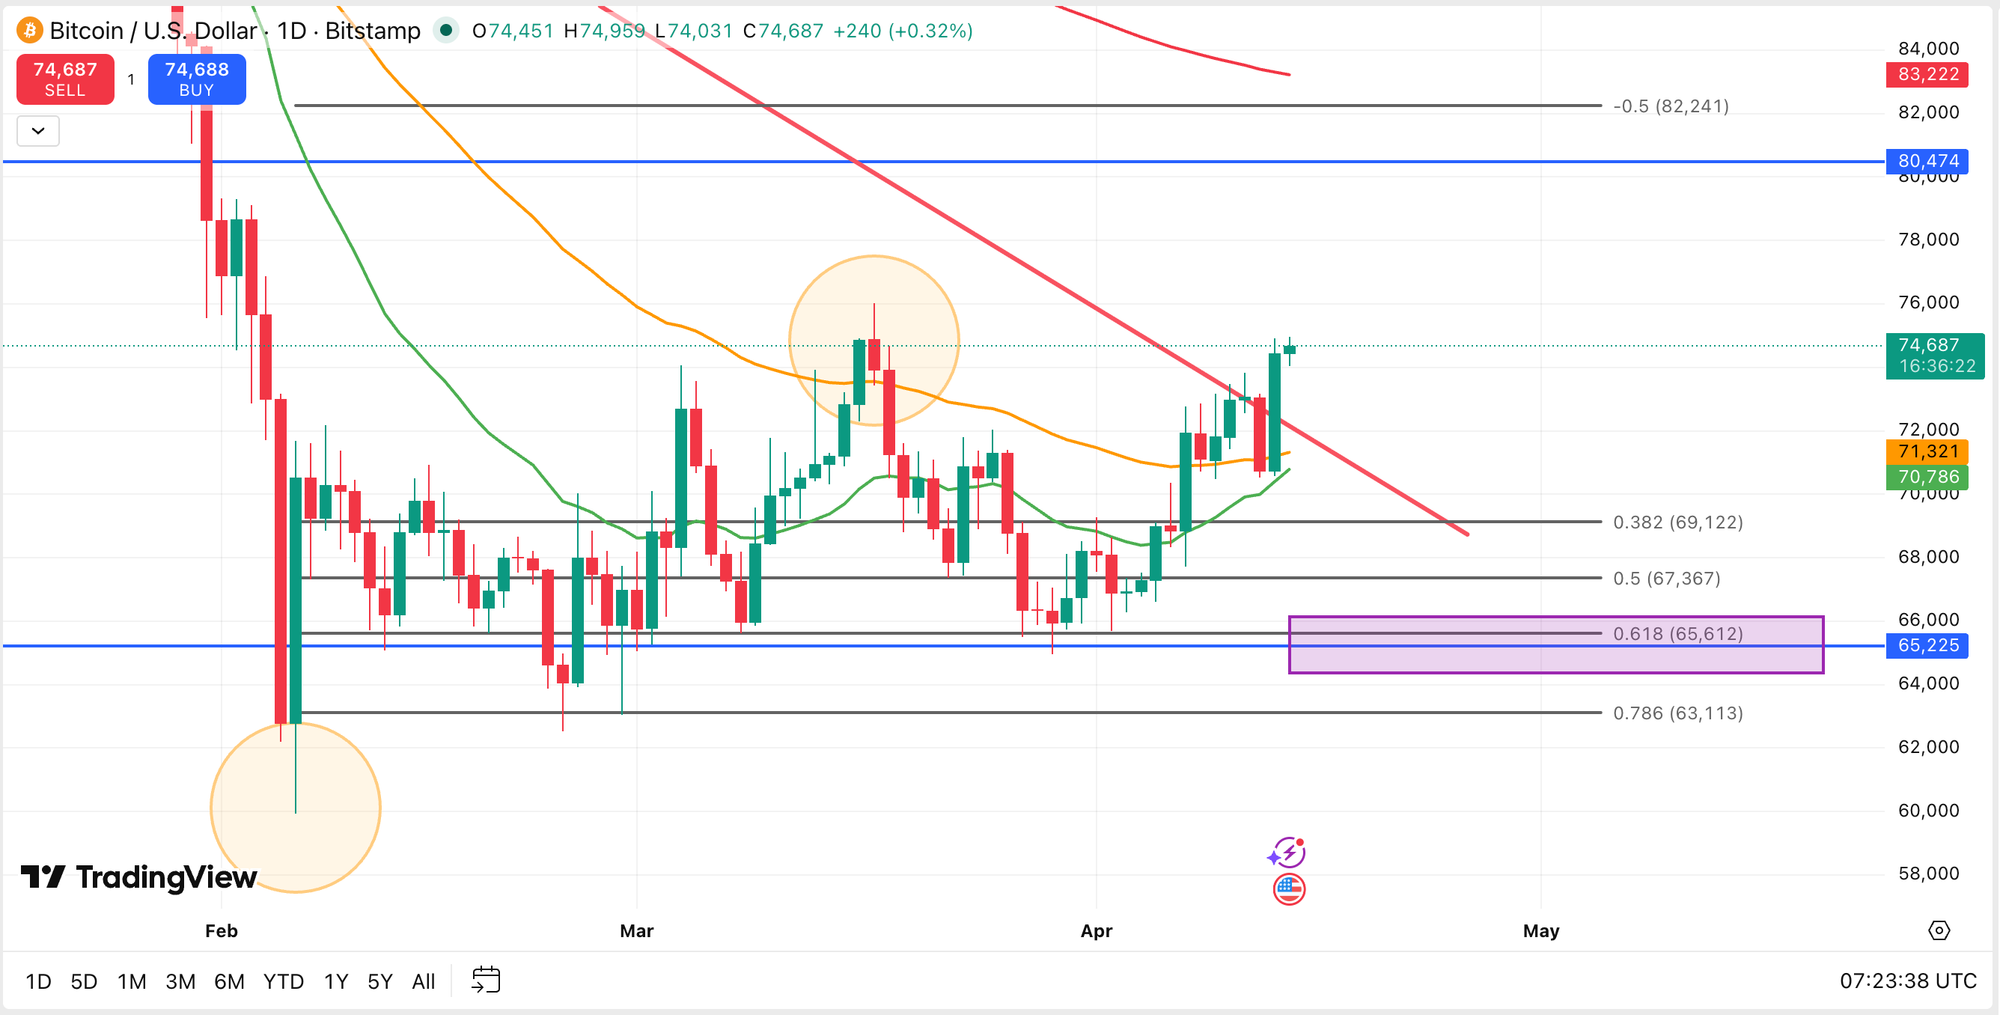
Find the lowest point on the chart - the bottom of the most recent move down. Click there and now drag your Fib tool up to the highest point, using the close of the candle, not the wick. That's your range.
Once it's drawn, look at what happens. Some of those Fib lines will line up almost exactly with where price action paused, bounced, or reversed. That's not luck, that's the market respecting levels. Pay particular attention to the 0.618 level, also known as the Golden Pocket. It's the level traders worldwide watch most closely, and price tends to bounce there before continuing in the original direction.
There are more nuances and reasons why, and we will get there.
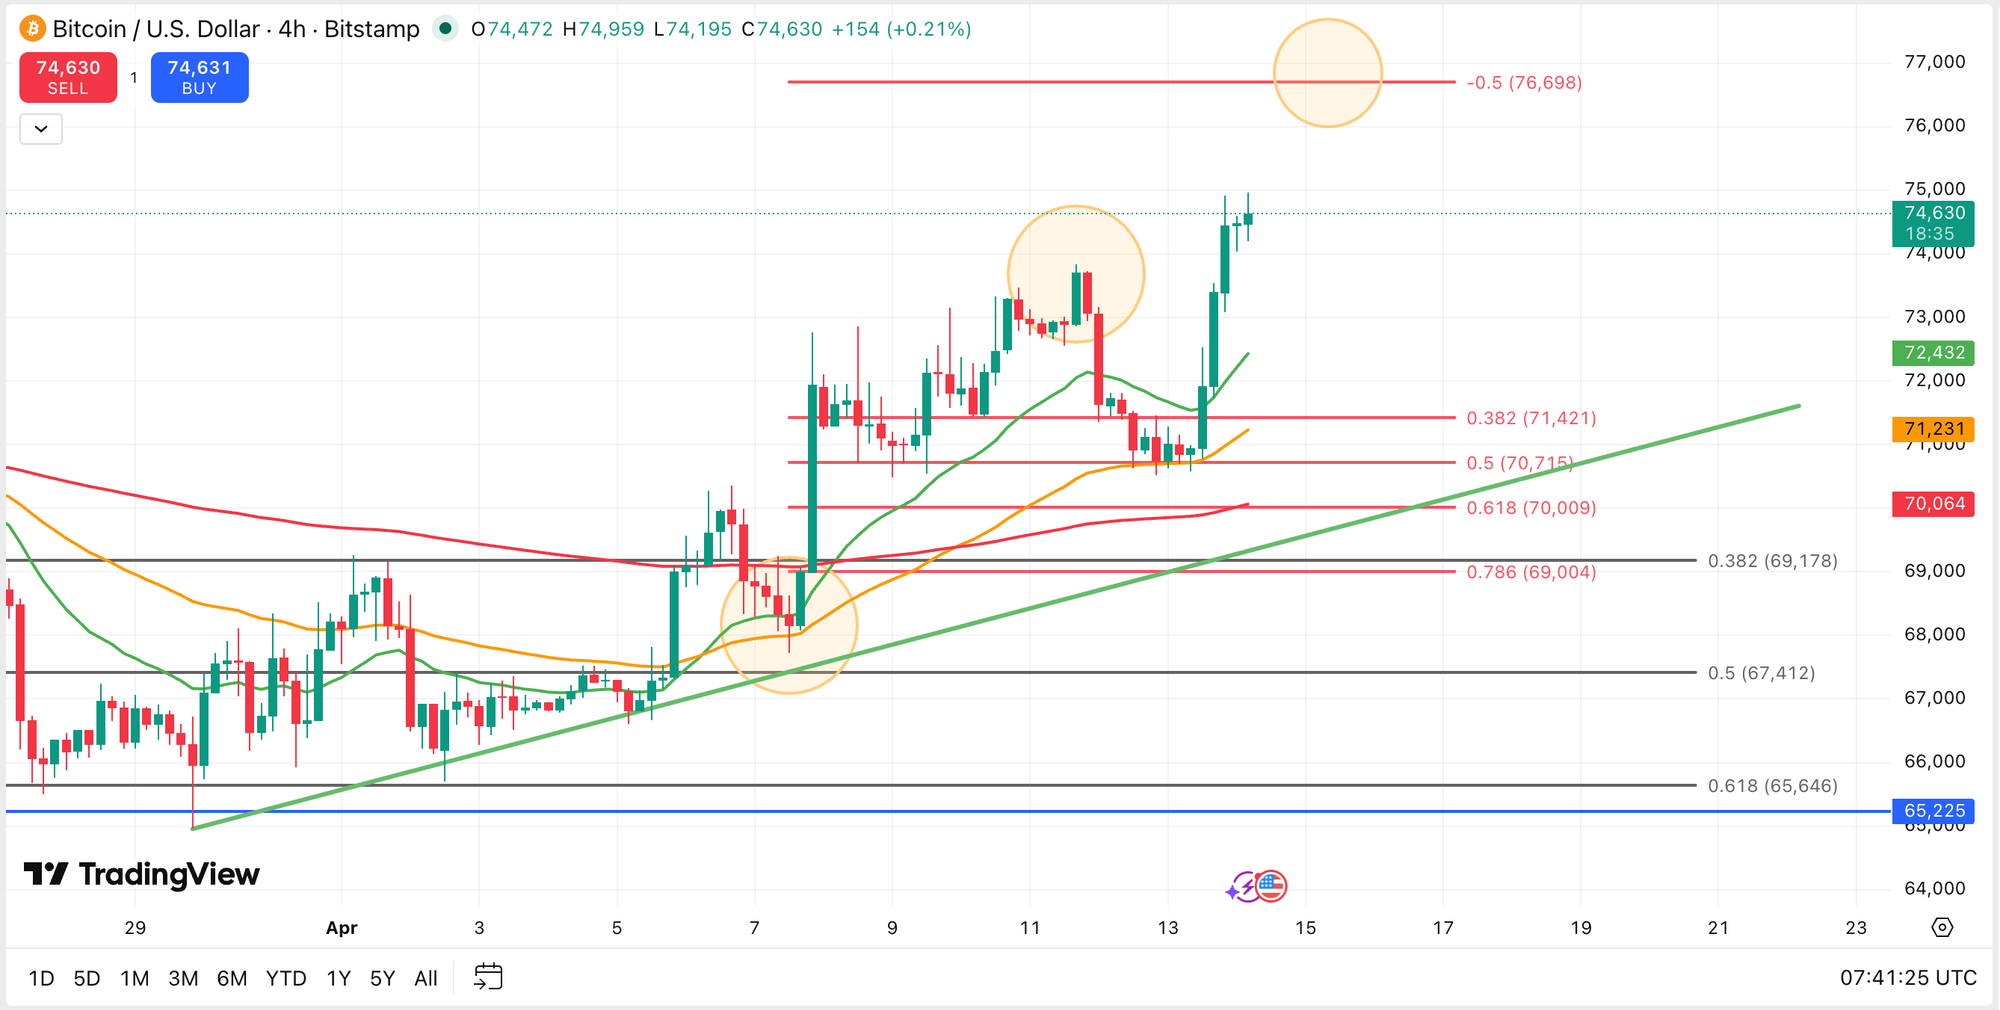
Fibonacci on the 4H
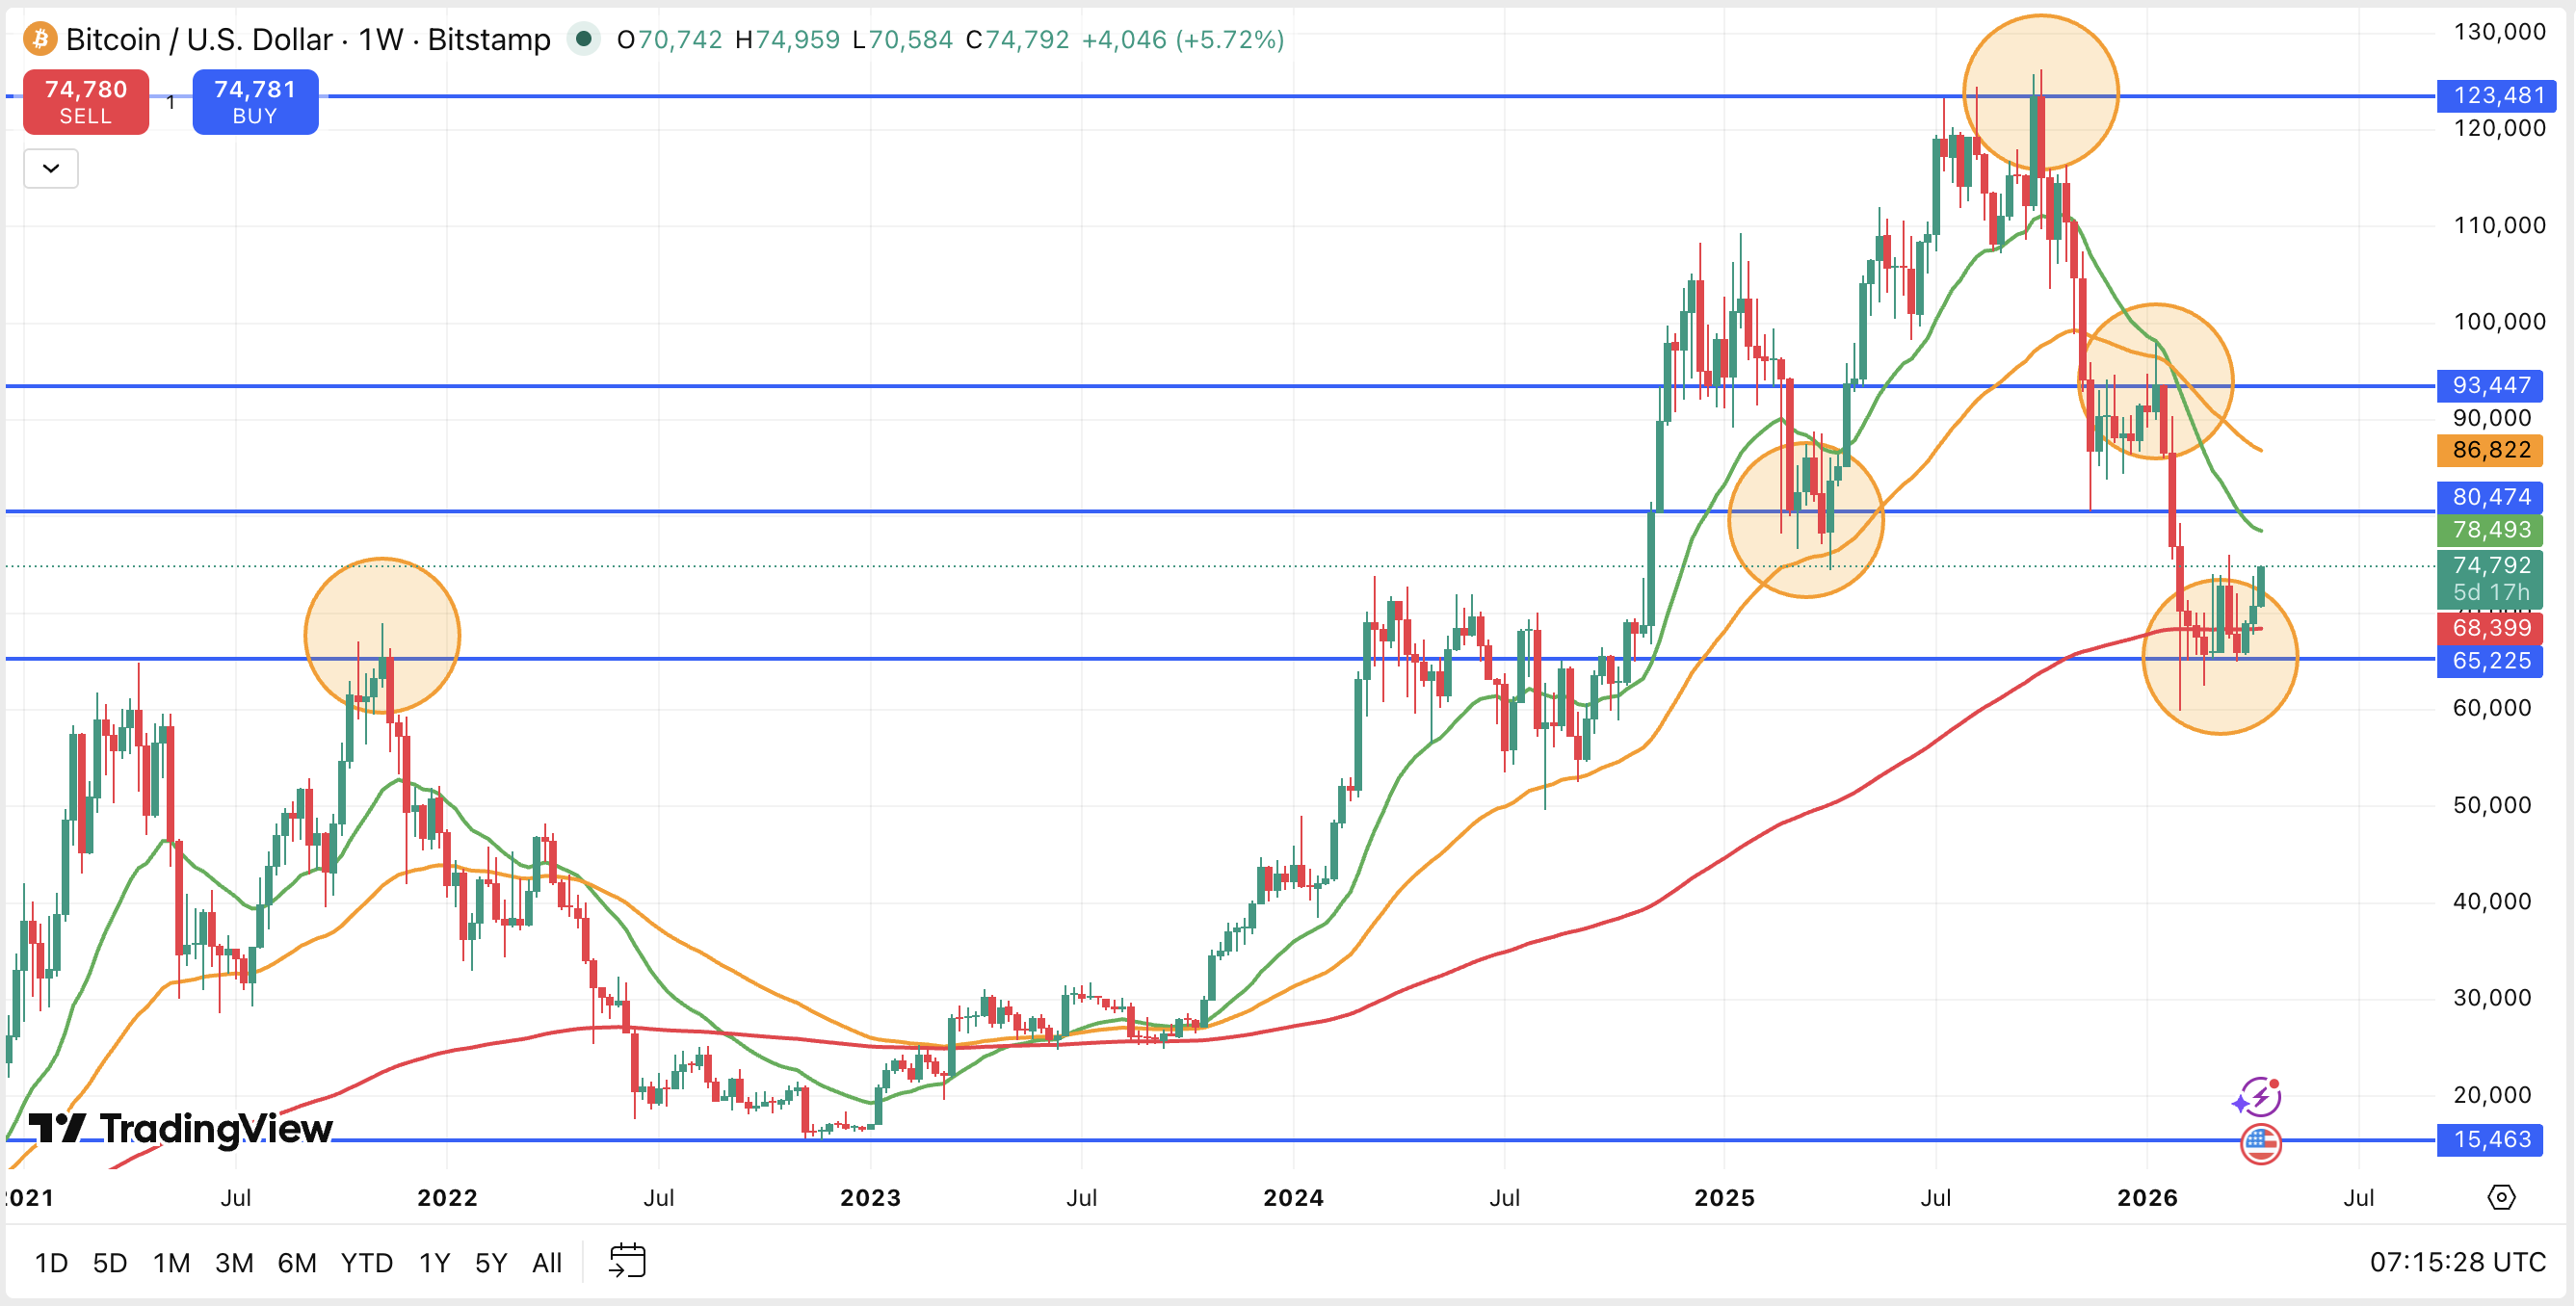
Drop down to the 4H chart and draw a second Fib. This time, drag from where price bounced off the EMAs (your Exponential Moving Averages, the curvy lines) and pushed up to the high point where it turned back down.
You'll see these points marked with orange circles in the chart above.
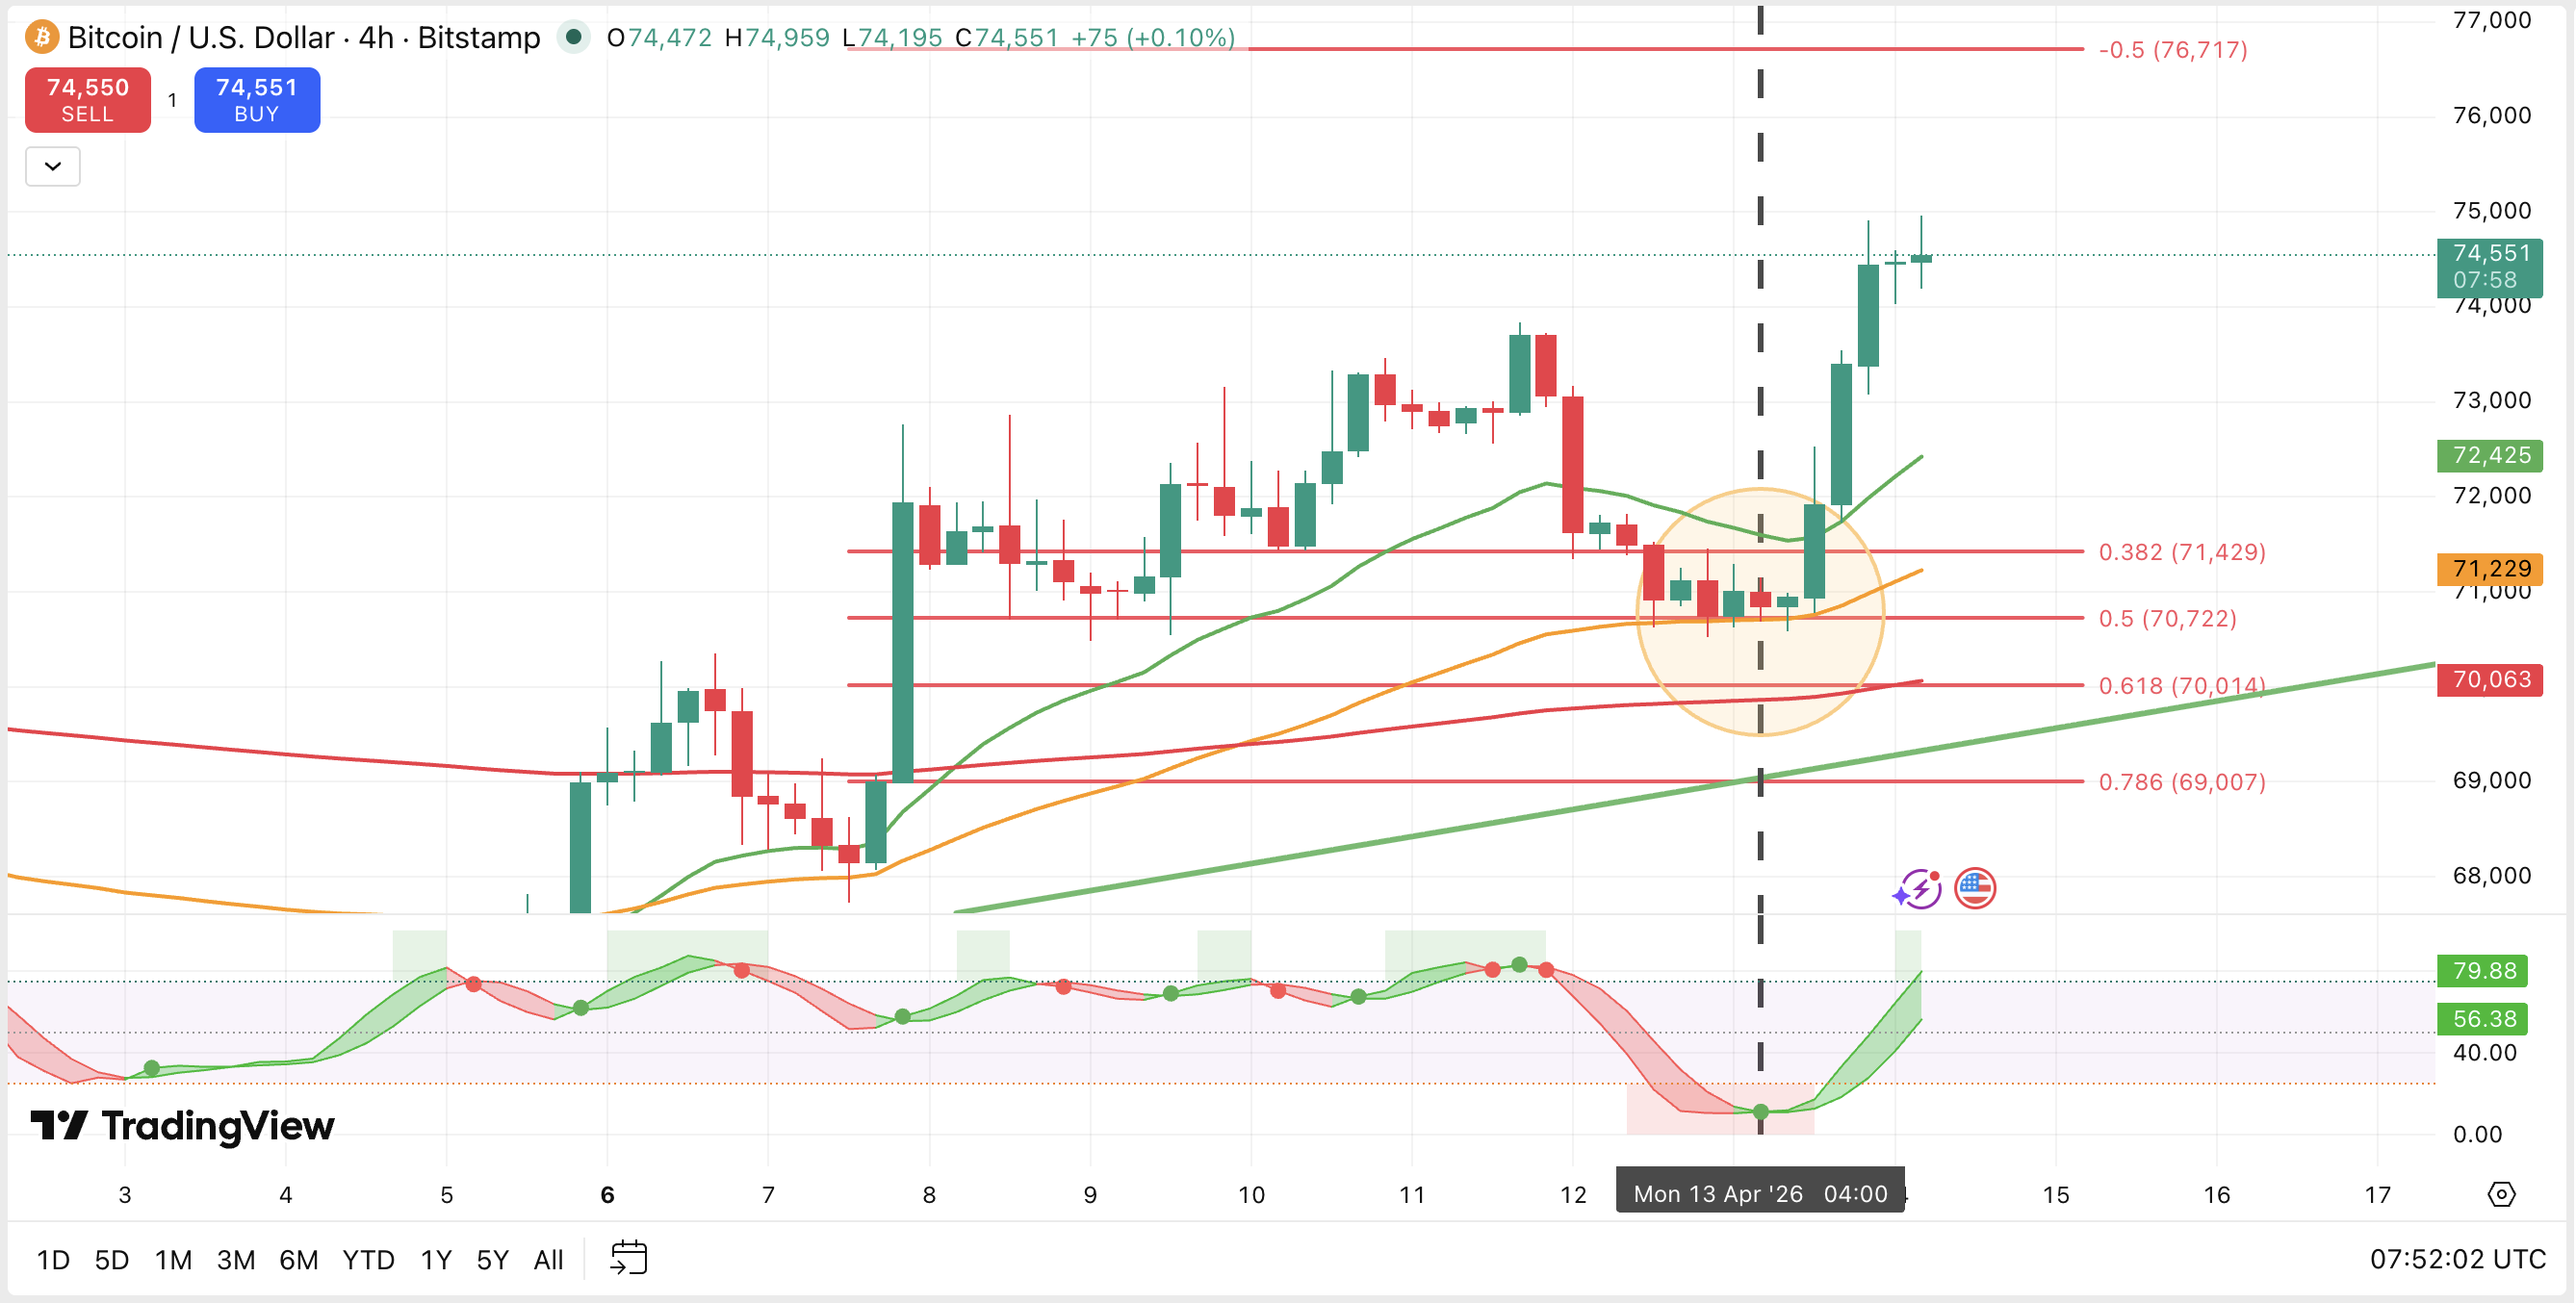
Stochastic and EMAs
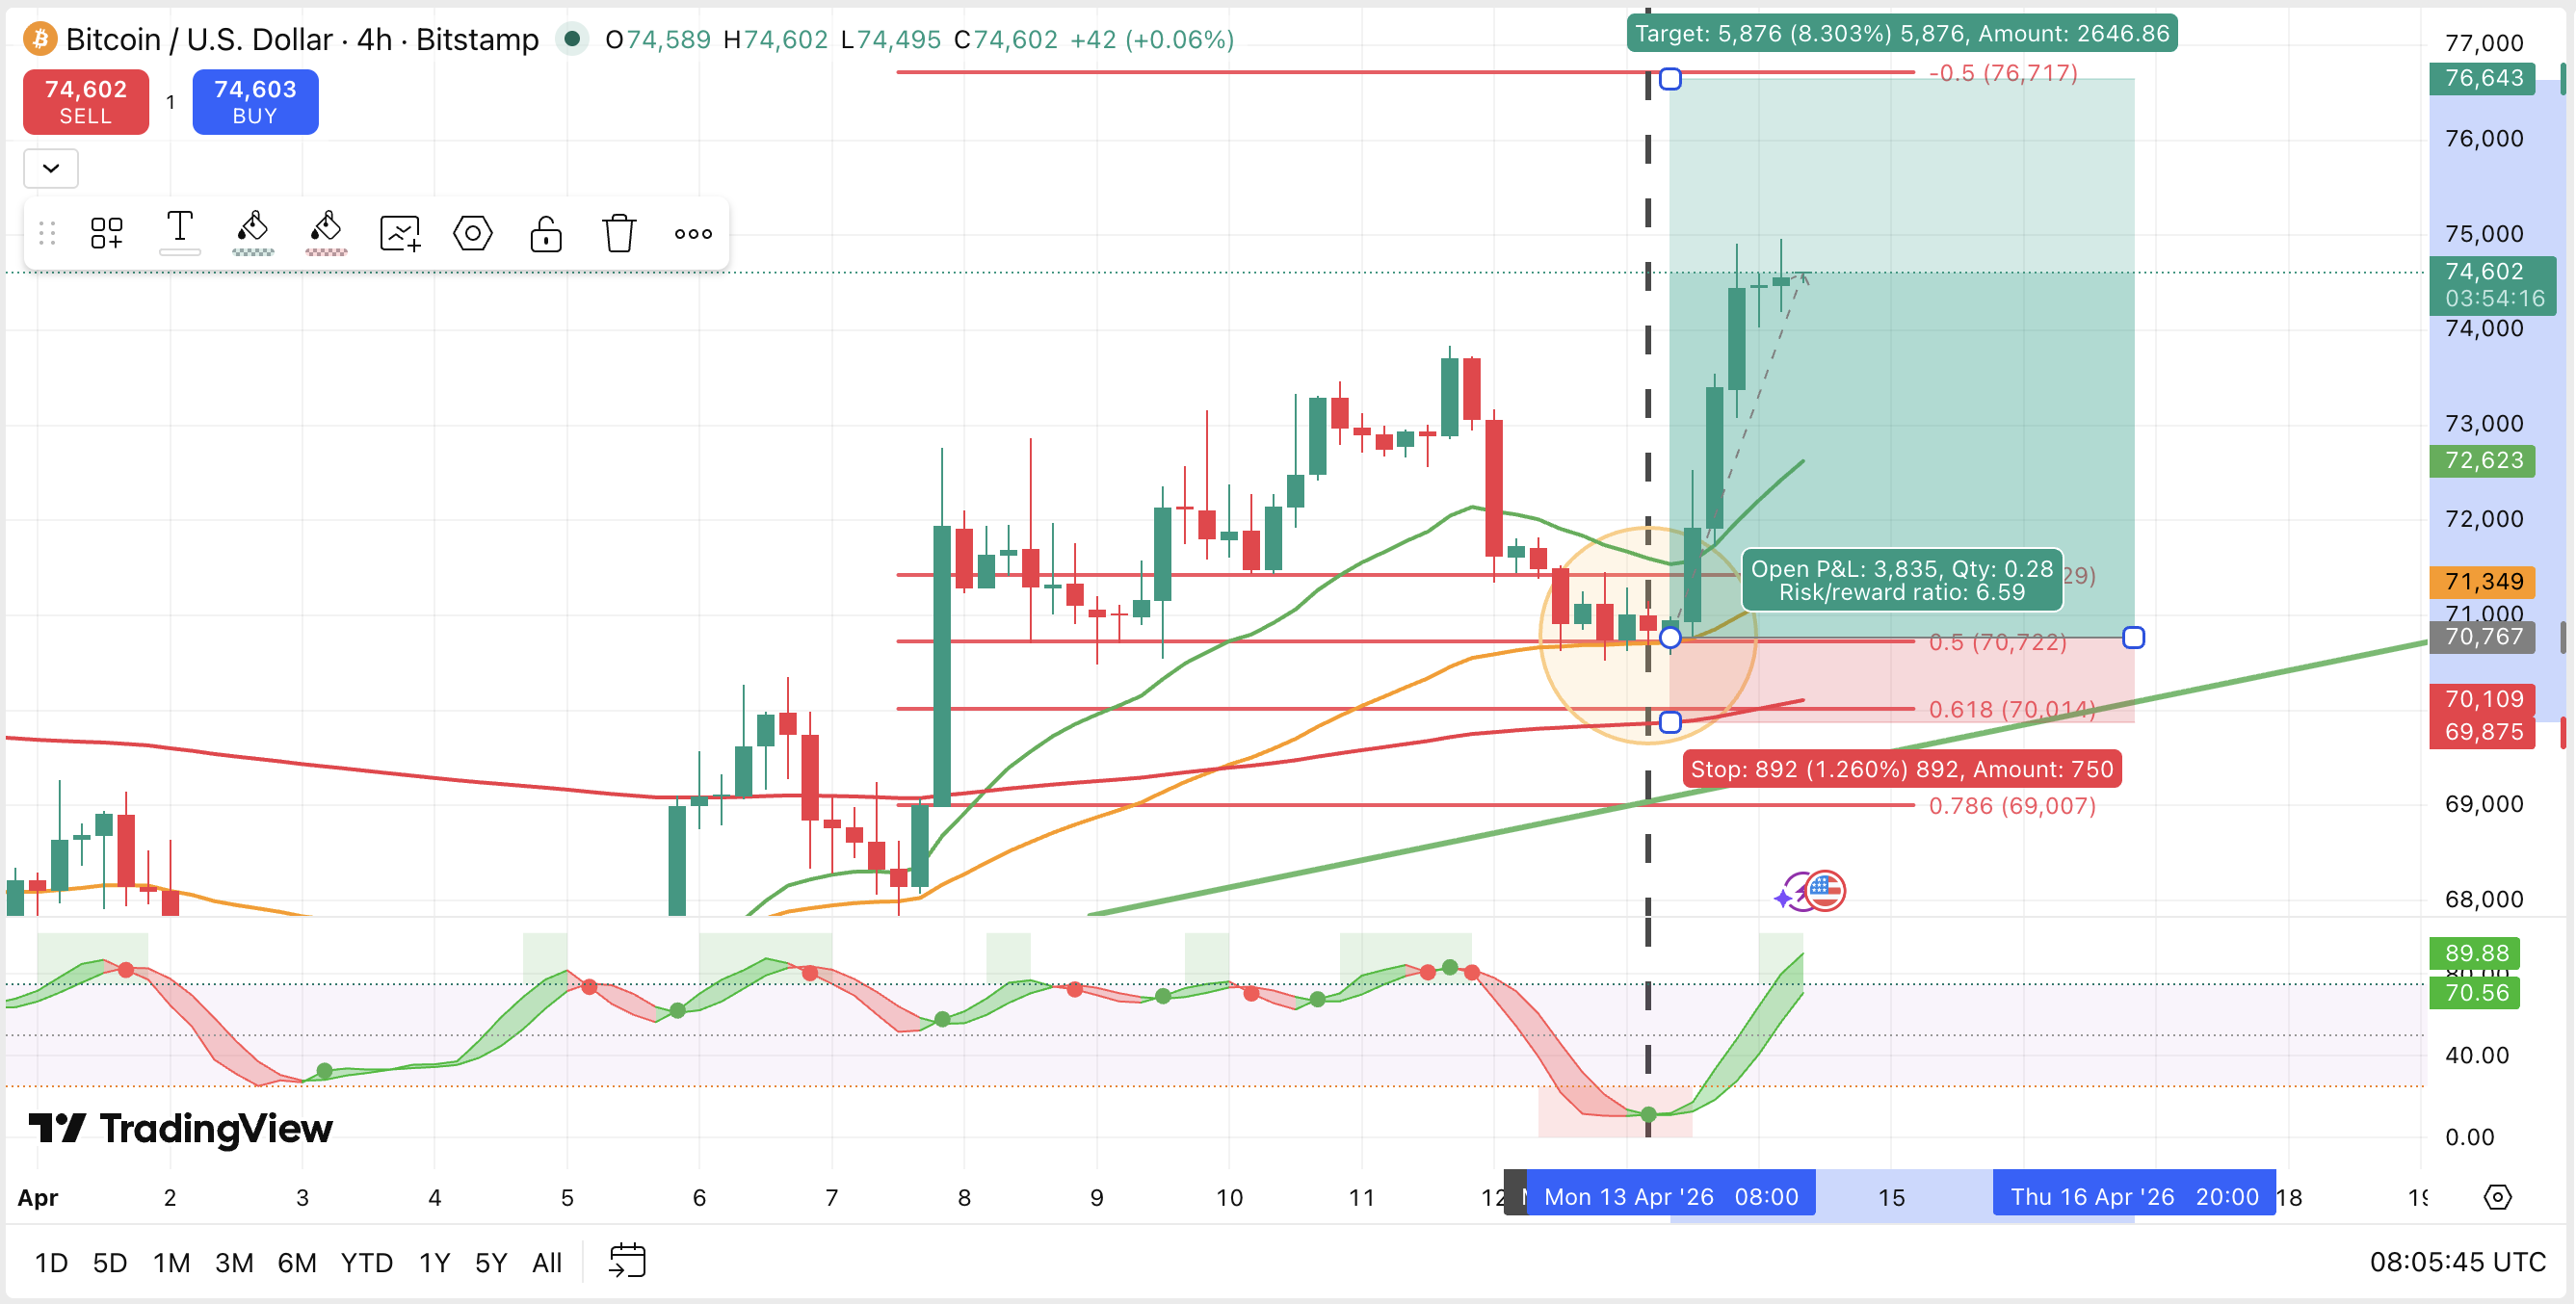
What is the momentum telling you? Are the EMAs aligned - green above orange, orange above red? You can see price is bouncing right on the 55 EMA (orange circle) acting as a resistance, and also on the 0.5 Fib. There is a little cluster forming there. This is normally called confluence, but I prefer cluster.
Calculate Risk vs. Reward
Use the amazingly simple Risk : Reward tools on TradingView to map out your trade visually.
Find the tool in the left toolbar - it sits under Forecasting & Measurement.
There's one called Long Position for when you believe the price might move up, and one for Short Position too. For today, we're scoping out a Long Position, so select that, then click on the exact price level where you are thinking of entering (or even just click at the current price, then you see it straight away), and it will appear there.
From there, drag the bottom corner (in the red) down to set your risk - this is where your stop loss would sit, below your entry for a Long Position. Now drag up the top corner (in the green) to set your reward - this is your take profit target.
TradingView calculates the ratio automatically and shades the zones green and red so you can see it visually at a glance.
You always want to be making at least three times more than you're risking. So if you're risking $20 based on where your Stop Loss goes, your target Take Profit price should bank you at least +$60. If the numbers don't stack up - the trade doesn't qualify. Simple.
Before you place the trade, jump into the MWT app and run the numbers through the calculator. Put in your trade amount,your entry, the price level of your risk, and the price target of your take profit. The calculator shows you exactly what you stand to win or lose based on the amount you're putting in - so there are no surprises when the trade closes. This is the step most beginners skip, and it's the step that keeps you in the game long term.
As you can see in the chart above, price has already moved up so we can't take this trade now. It's here to show you what a setup looks like when everything is aligned and the timing is right.
Now zoom in even more...
Once the daily and 4H picture looks good, move down to the 1 hour and 15 minute charts. You're checking that the story is still the same on a smaller scale. Do the indicators match up? Is price behaving consistently with what the bigger picture showed you?
If yes, you have a setup worth looking at. If the smaller timeframes tell a different story - step back and wait. The market will give you another chance.
Pardon the dude-analogue here, but trading is a lot like fishing. It can't be forced, you plan as well as you can, you cast your line...and you wait for the bite.
You've got this. 💚 Mel
← Lesson 05: Setting Up TradingView · Next up: Lesson 07: Take Your First Paper Trade → Start Here
This lesson is for educational purposes only. Always do your own research before making any trading decisions.