Lesson 05 | Setting Up TradingView - Your Chart, Your Tools

I remember the first time I opened TradingView properly. Lines everywhere. Buttons I was too scared to click. I closed the laptop and went to make tea.
If that sounds familiar - good. You're normal. Nobody explains this stuff. That's what this lesson is for.
By the end, your chart will be clean, set up the way we trade, and already starting to tell you a story. Let's go!
TradingView is used by nearly 100mn traders all over the world, and works great on your phone or laptop. We use this app all day, every day, and couldn't trade without it. For learning trading with me, TradingView is an absolute must-have.
Step 1: Get Your Free Account
Go to TradingView and click Get Started For Free. Sign up with Google or your email - whichever you prefer.
Tip: Use the same login method you use in the MWT app. Keeps everything in one place.

Set your own username, and once you're in, go to Products → SuperCharts. That's your chart. That's home.

Step 2: Understanding What You're Looking At
Your chart opens with a few things already on screen. Here's what matters:
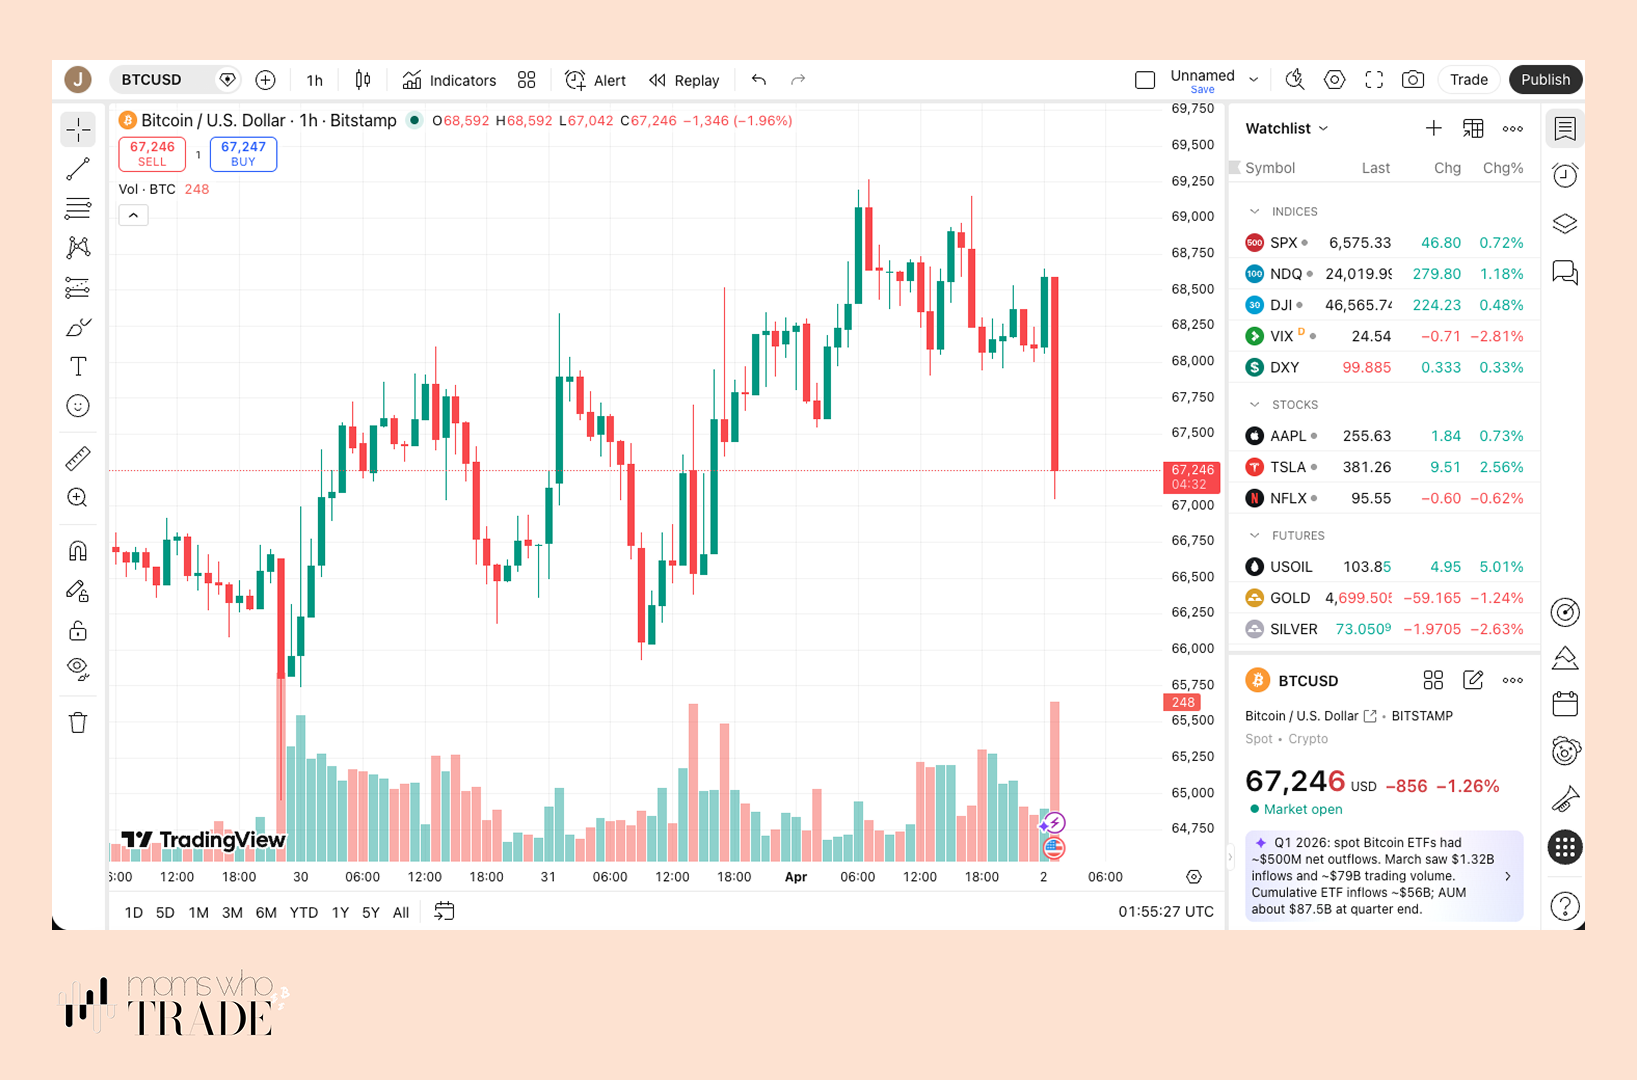
- Symbol - top left. This is your asset, always shown as a pair (e.g. BTC/USD - Bitcoin priced in US Dollars). Click it to search for something else.
- Timeframe - next to the symbol. This is where you set your 4H, 1D, etc.
- Candles - leave these as the default. You already know how to read them from Lesson 4.
- Indicators - we'll set these up below. Ignore anything already loaded for now.
On the right side of your screen is your Watchlist panel. This shows current prices and how they're moving. It's the first thing you'll check every day.
Step 3: Build Your Watchlist
Your watchlist comes pre-loaded with some default symbols. Let's clean it up and make it yours.
To add an asset: click the + sign at the top of the watchlist and search by name. When selecting a chart provider, always use:
- Crypto → Binance
- Stocks → Nasdaq or CME
- Commodities → Capital.com
To remove something: hover over the symbol and click the trash can icon that appears on the right.
Your watchlist saves automatically. Build it slowly - only add things you're actually learning about.
Step 4: Tools on the Left
The left toolbar with the row of icons running from top to bottom is your drawing kit. Click any tool and a drawer opens with options. The ones we use:
- Trend Tools - for drawing trend lines (more on this below)
- Gann & Fib - for your Fibonacci retracement tool ⭐️
- Forecasting & Measurement - includes the Risk:Reward tool
- Geometric Shapes - for marking up your chart
Mom tip: turn on the Magnet tool. It snaps your lines to exact wicks and closes so you're not guessing. Find it in the toolbar and keep it on - even in 'Weak' mode.
Drawing a trend line: Select the trend line tool, then click two points on the chart connecting the lows (for an uptrend) or the highs (for a downtrend). This is how you visually confirm which direction the market is moving. More on this later.
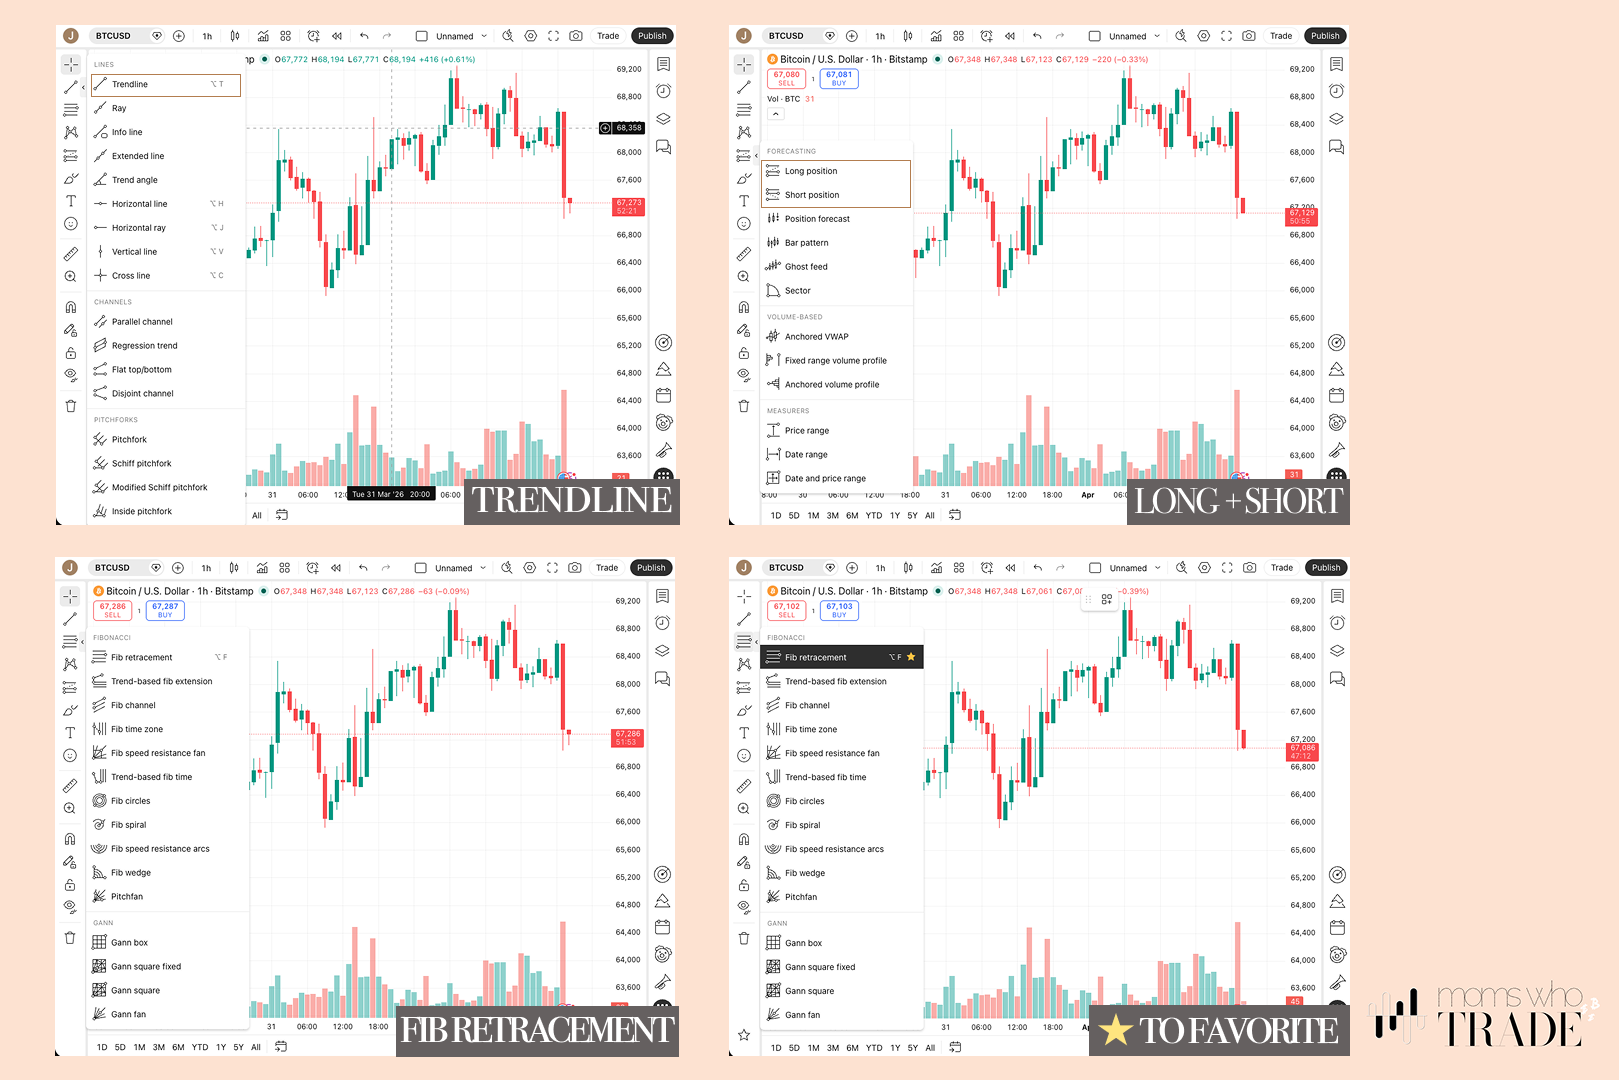
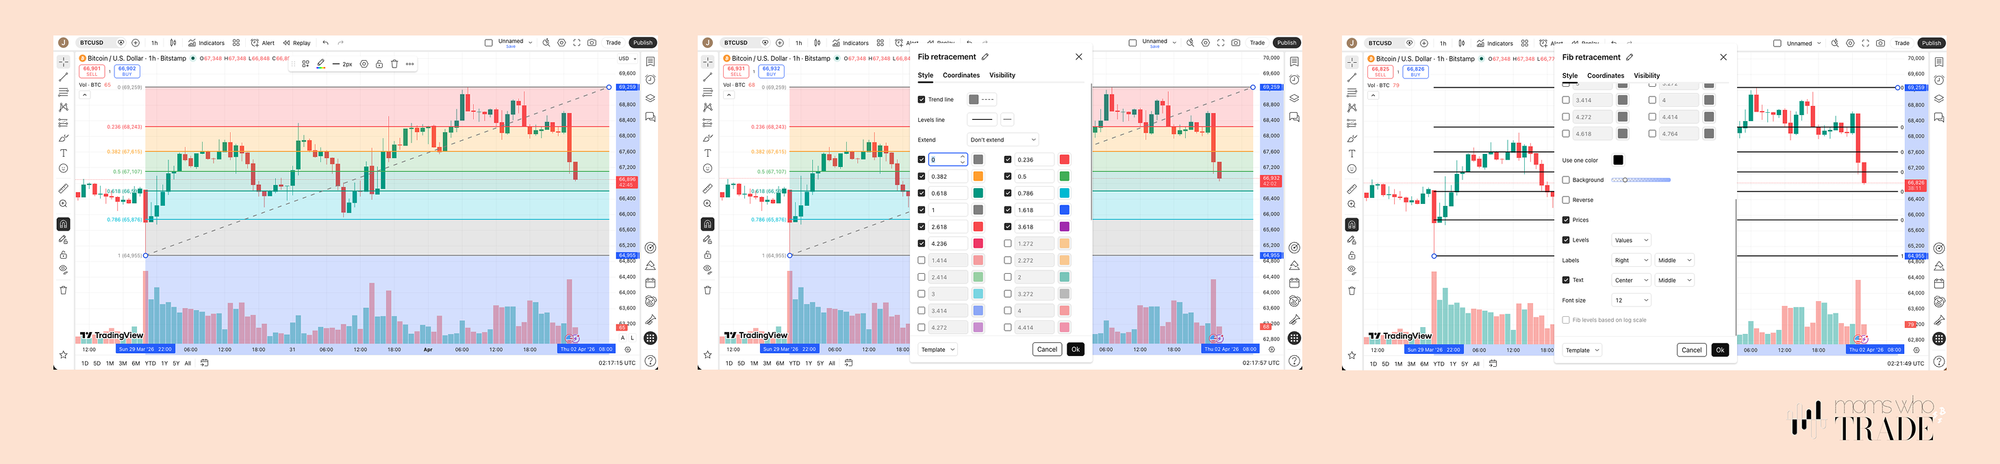
Step 5: Set Up Your Fibonacci Retracement
The Fib tool is in Gann & Fib on the left toolbar. Before you use it, we need to set it up our way - it comes with too much noise by default.
Draw a rough Fib first - similar to how you would draw a trend line above, then double-click any line to open settings. Make these changes:
Style tab:
- Deselect Trend Line
- In "Use one colour" - choose black or a high-contrast colour
- Deselect Background
- Labels: Right / Middle. Text: Centre / Middle. Font size: 10
Values tab:
- Row 1: uncheck both values
- Row 2 & 3: leave as is
- Row 4: deselect the first value, change the second to -1.618
- Row 5: change to -2.618 and -3.618
- Row 6: change the first value to -0.5, uncheck all other boxes
Press OK. Then delete this Fib and draw a fresh one with your new settings saved.
How to draw it correctly: Find a clear wave on the chart - a low point followed by a high point. Click the lowest wick, drag to the highest close (not the wick - the body close). You'll see the candles bouncing off those Fib lines as they move. That's the chart confirming the levels matter.
Mom tip: The market almost always moves in loops or hoops. It's our job to scan the candles for these, and over time, your eyes will learn to identify them clearly 👇
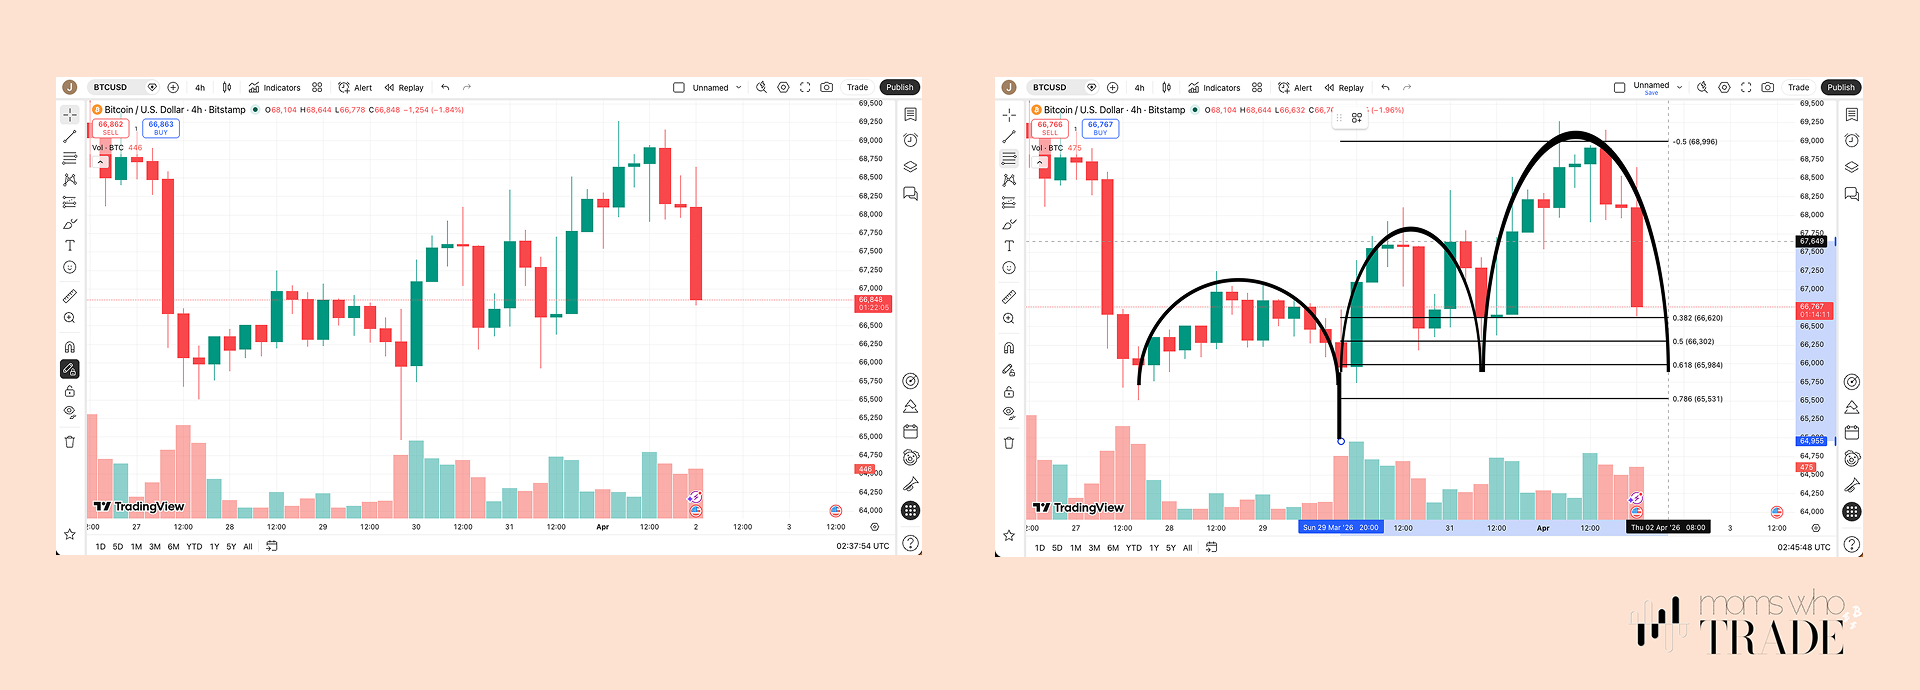
Before you draw your Fib, watch the short video below - it shows you how to drag the X and Y axis to resize your candles so you can actually see the wave clearly before drawing. Getting the chart sized right makes a big difference. Once your candles are visible and the wave is clear, the video walks you through drawing the Fib correctly from low to high. Watch it once, then try it yourself.
Step 6: Add Your Moving Averages
Moving averages are the simplest way to understand the direction of a trend. We use three together because together they tell a story. We like to use Exponential Moving Averages (EMA's), but some traders use Simple Moving Averages or other methods. Again, over time, you will figure out what gives you the clearest signal.
In the Indicators search bar at the top, search for: CT Moving Avg Crossover Indicator by The Caretaker. It's free. Star it and add to favourites.
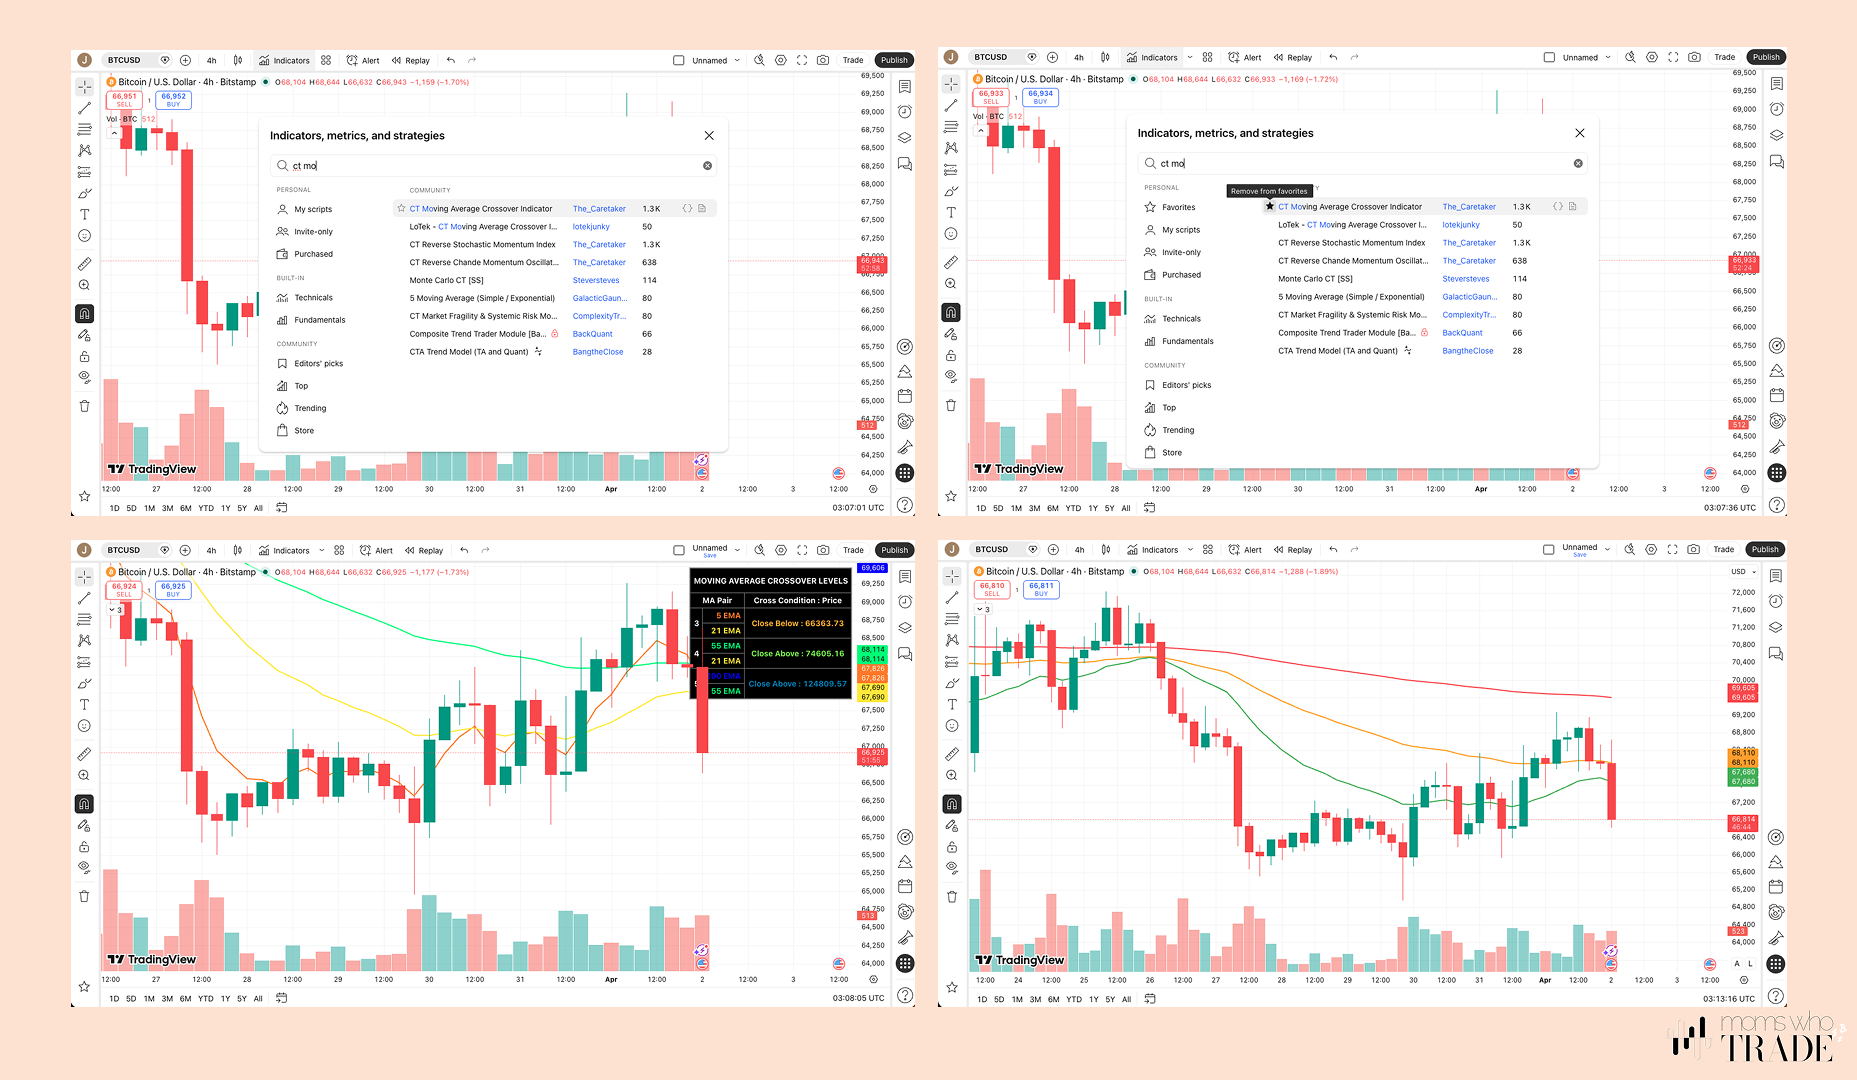
Double-click the lines it draws to open settings:
- Deselect EMA No.4 (5) - you only want three lines: 21, 55, and 200
- Colour them like a traffic light:
- 21 → Green (moves fastest, reacts first)
- 55 → Orange (slower to react)
- 200 → Red (the big picture - slowest to change)
- Scroll down and uncheck the two Info Panel boxes
Press OK.
When green sits above orange, and orange above red, the trend is up. Simple as that. In the next lesson, we will discuss the magic that happens when they cross over each other, too.
Step 7: Add Your Momentum Indicator
The free TradingView plan limits the number of indicators you can run. To make room, we're going to remove the default volume bars and replace them with something slightly more actionable.
Click Indicators → expand the Indicators Legend tab (top left of your chart) → find VOL and remove it.
Now search for Stochastic by Everget. Star it, add to favourites, and add it to your chart.
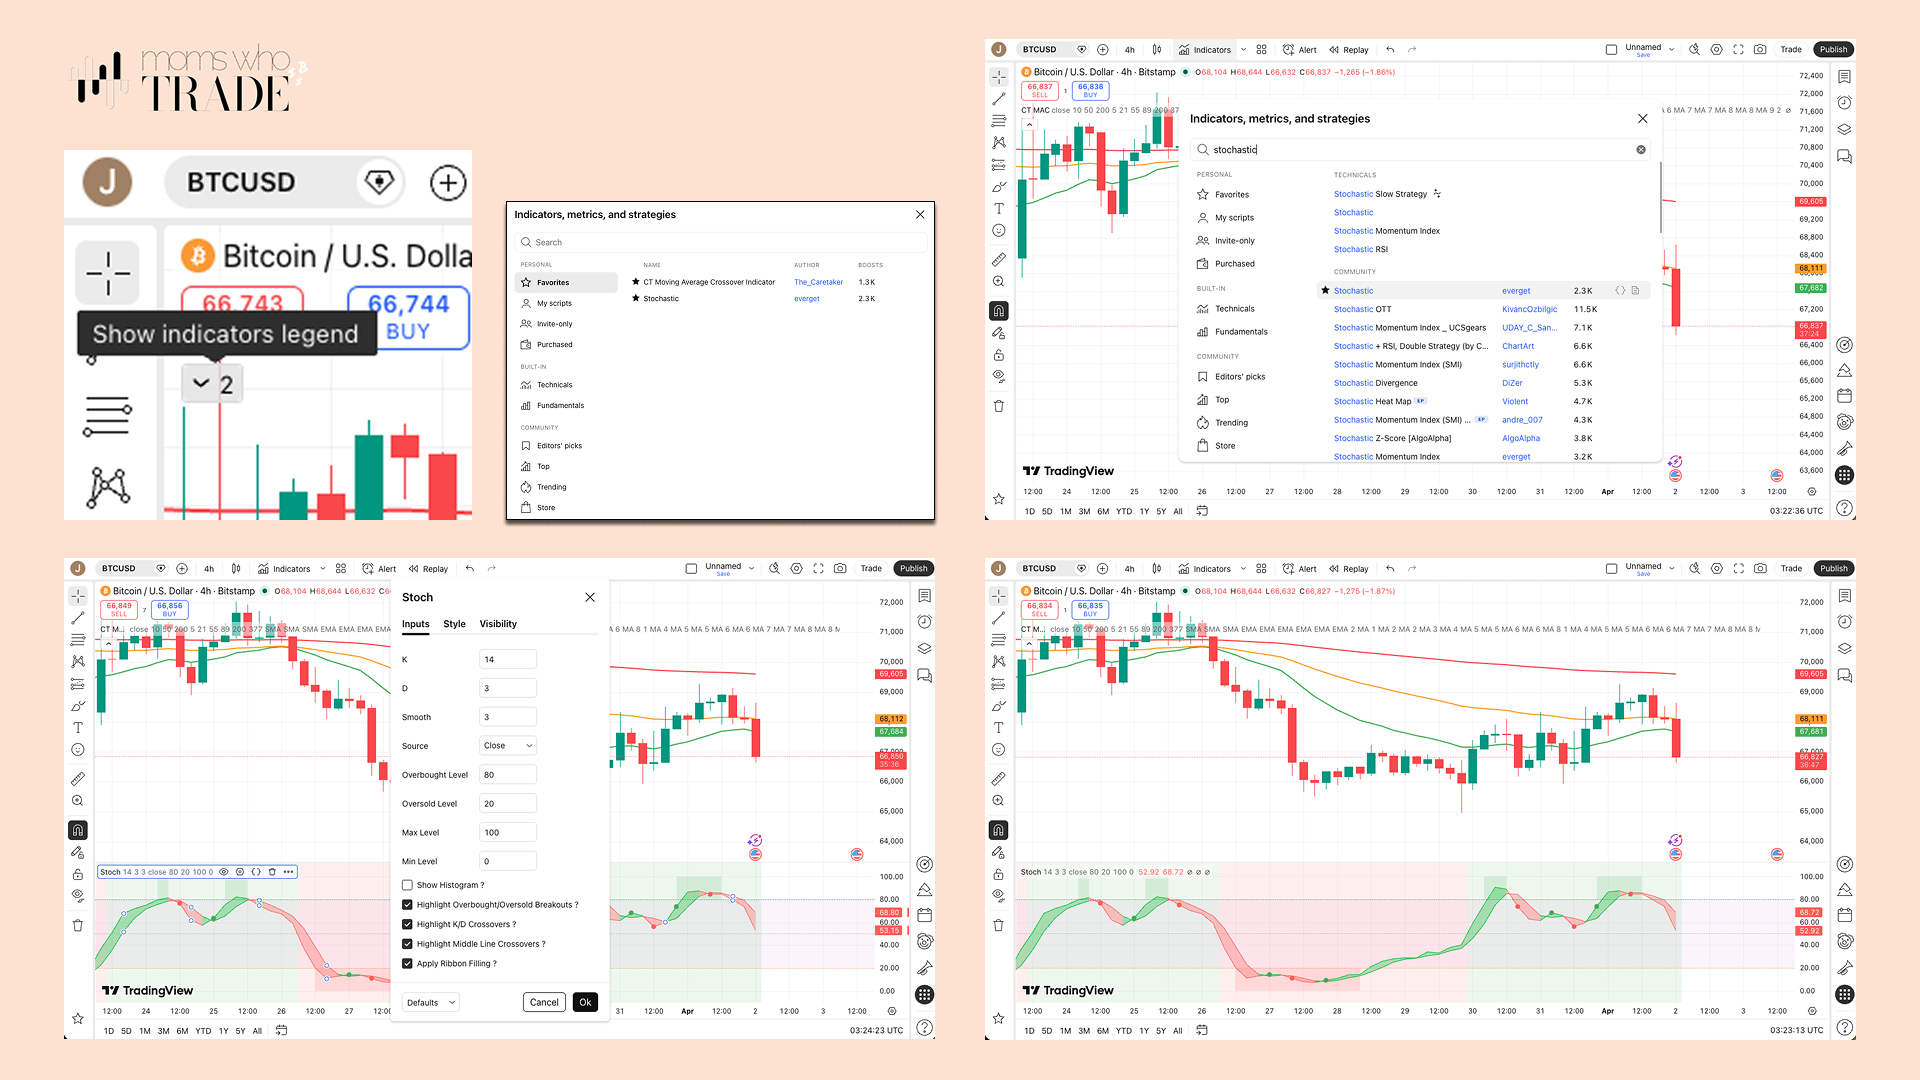
Double-click any of its lines to open settings and make these changes:
- D → 4
- Smooth → 5 (this slows it down for more reliable signals)
- Deselect Highlight Middle Line Crossovers
- Set Overbought at 75, Oversold at 25
- Press OK
We don't use this to blindly decide when to buy or sell. We use it to understand how much momentum the trend has. Think of it as a gauge - how much energy is left in the move?
Nice work! You're All Set Up
Your TradingView is now ready to use on any asset you want to watch - crypto, commodities, stocks.
Look at your chart now. With the moving averages loaded, the Fib drawn, and the stochastic running, you should already be starting to get a hunch about which direction your chosen asset is moving. That hunch is the beginning of reading a chart.
In our next lesson, we're going to take everything you've set up here and use it to scope out your very first practice trade. Step by step. No real money. Just the method.
You've got this.
💚 Mel
Prefer to watch? I walk through this whole setup on video.
How to set up TradingView from scratch, the exact way we trade, all on the free version. I show you how to add the moving averages we use, set up your Fibonacci tool, and get your chart looking clean instead of a wall of squiggly lines.
If you've ever opened TradingView and felt completely lost, this is the video that fixes that. By the end you'll have a chart that's set up to read the market the way we do, from your phone or laptop.
Copy my setup step by step and you're ready for Lesson 06.
← Lesson 04: How Trading Works · Next up: Lesson 06: Plan Your First Trade → Start Here
This lesson is for educational purposes only. Always do your own research before making any trading decisions.