Lesson 04 | How Trading Works
When I first heard the word "trading," I pictured a room full of men in suits shouting at screens. Wall Street stuff. Not my world.
I got below average in math at school. I didn't know what a chart was. I definitely didn't think this was something I could do.
But here's the thing, trading is way simpler than it looks. And once someone explained it to me in plain language, I couldn't believe I'd been so intimidated by it.
So if you've just downloaded the app and you're sitting there thinking "OK... now what?", this one's for you. I'm going to walk you through the absolute basics. No jargon. No assumptions. Just the stuff I wish someone had told me from day one.
Understanding Markets
You already know what a market is. Grocery store - buyers and sellers, all in one place. The price of something goes up when more people want it, and down when they don't. Financial markets work the same way, just digitally. People buying and selling stocks, crypto, gold, and currencies.
Trading is simply buying something at one price and selling it at a different price. Buy low, sell high - you make money. Buy high, sell low - you lose. That's the whole game.
You've actually done this before. If you've ever picked something up at a thrift store and sold it for more, that's a trade. Or think about real estate. You buy a house for $250,000 and one day hope to sell it for $400,000 - not less than you paid for it, right? Same principle. Buy low, sell high.
But unlike real estate, you don't need a lot of money to get started. You can start with paper trading, which is practice trading with fake money on a real chart. Zero risk. That's exactly how I started.
The real skill? Learning when to buy and when to sell. And that's where the chart comes in.
What Am I Looking At When I Open a Chart?
The first time I opened TradingView, I thought I was looking at a foreign language. Lines everywhere. Numbers. Colours. It was overwhelming.
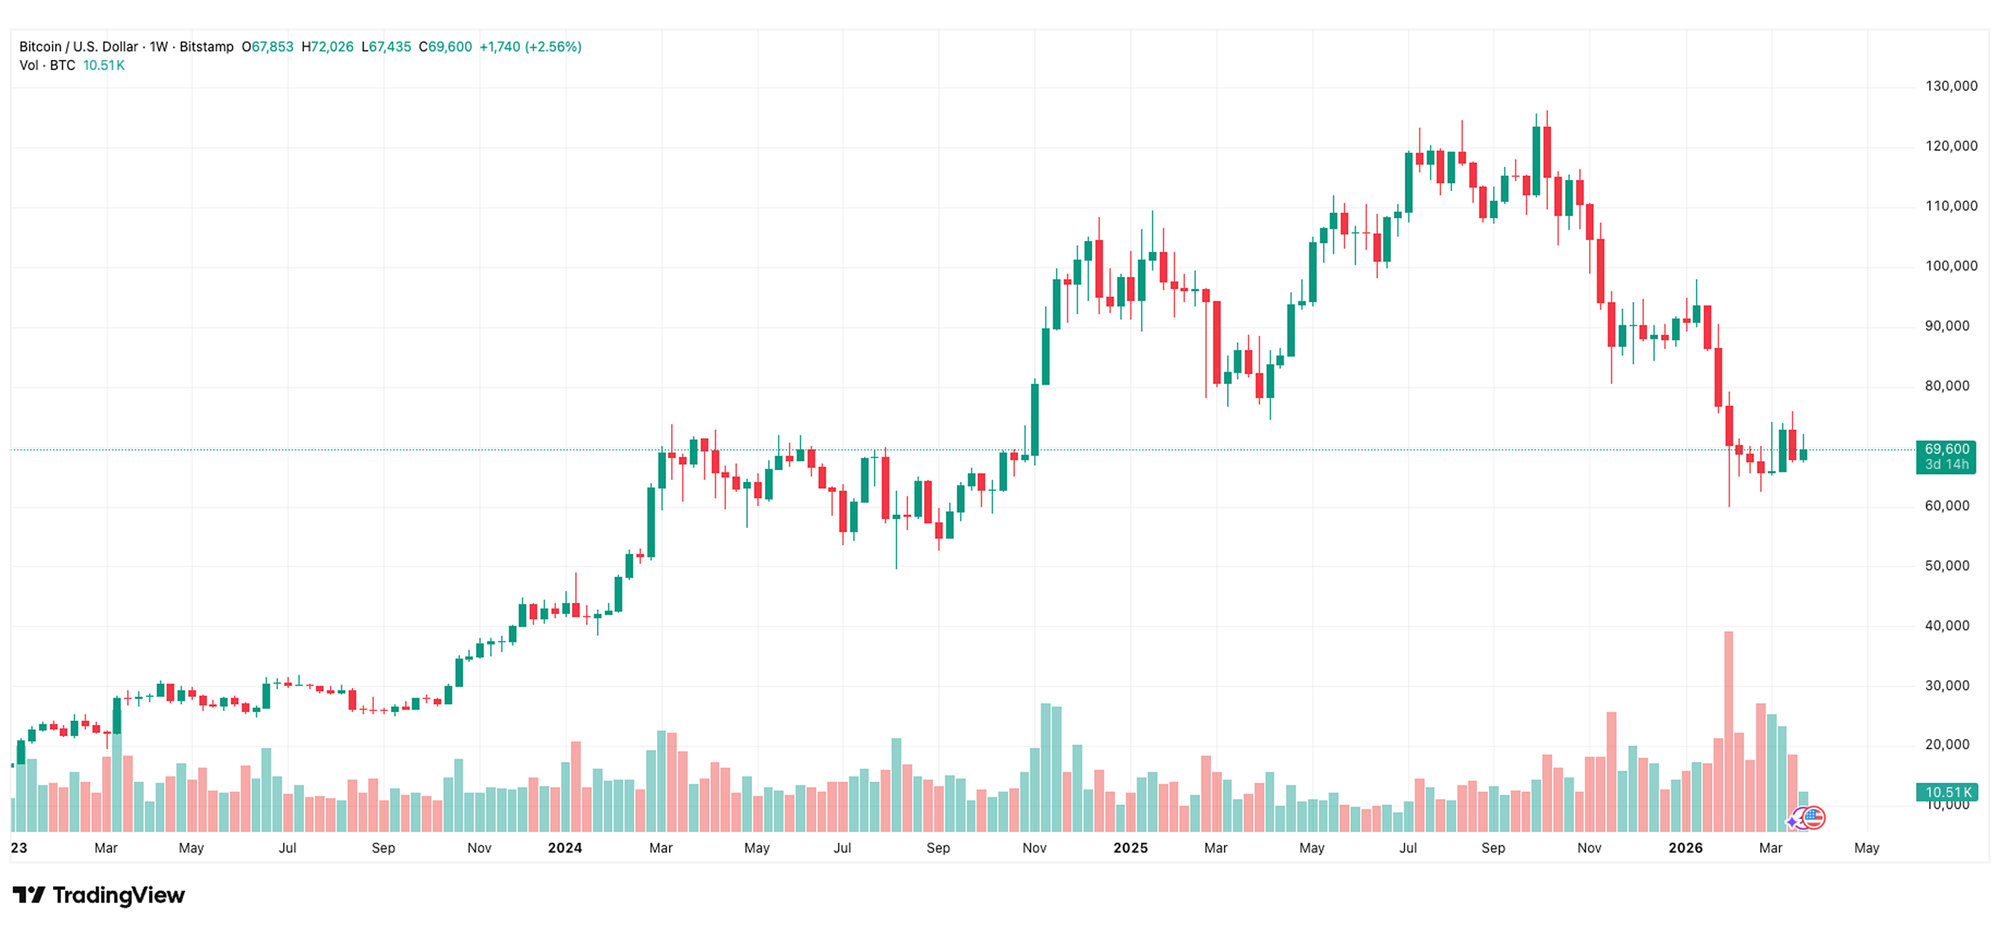
But a chart is actually really simple once you strip it back - A chart is just a picture of how the price of something has moved over time. That's it.
Left to right is time. Bottom to top is price. The number on the right-hand side? That's what it costs right now - the current price.
You'll also see a timeframe selector at the top. This tells you what each bar on the chart represents. On a 1-hour chart, each bar shows what happened in one hour. On a daily chart, each bar is one full day.
Think of the chart as a map. It shows you where the price has been. And there are tools and indicators you can add to this map that help you figure out which direction price could go next, where it might drop to, or how far it could run. We'll get into those in future lessons - for now, just getting comfortable reading the map is the first step.
Candles: The Secret Language of Charts
OK, this is the part that changed everything for me.
Those little coloured blocks on the chart? They're called candles. And once you understand what they're telling you, you'll never look at a chart the same way again.
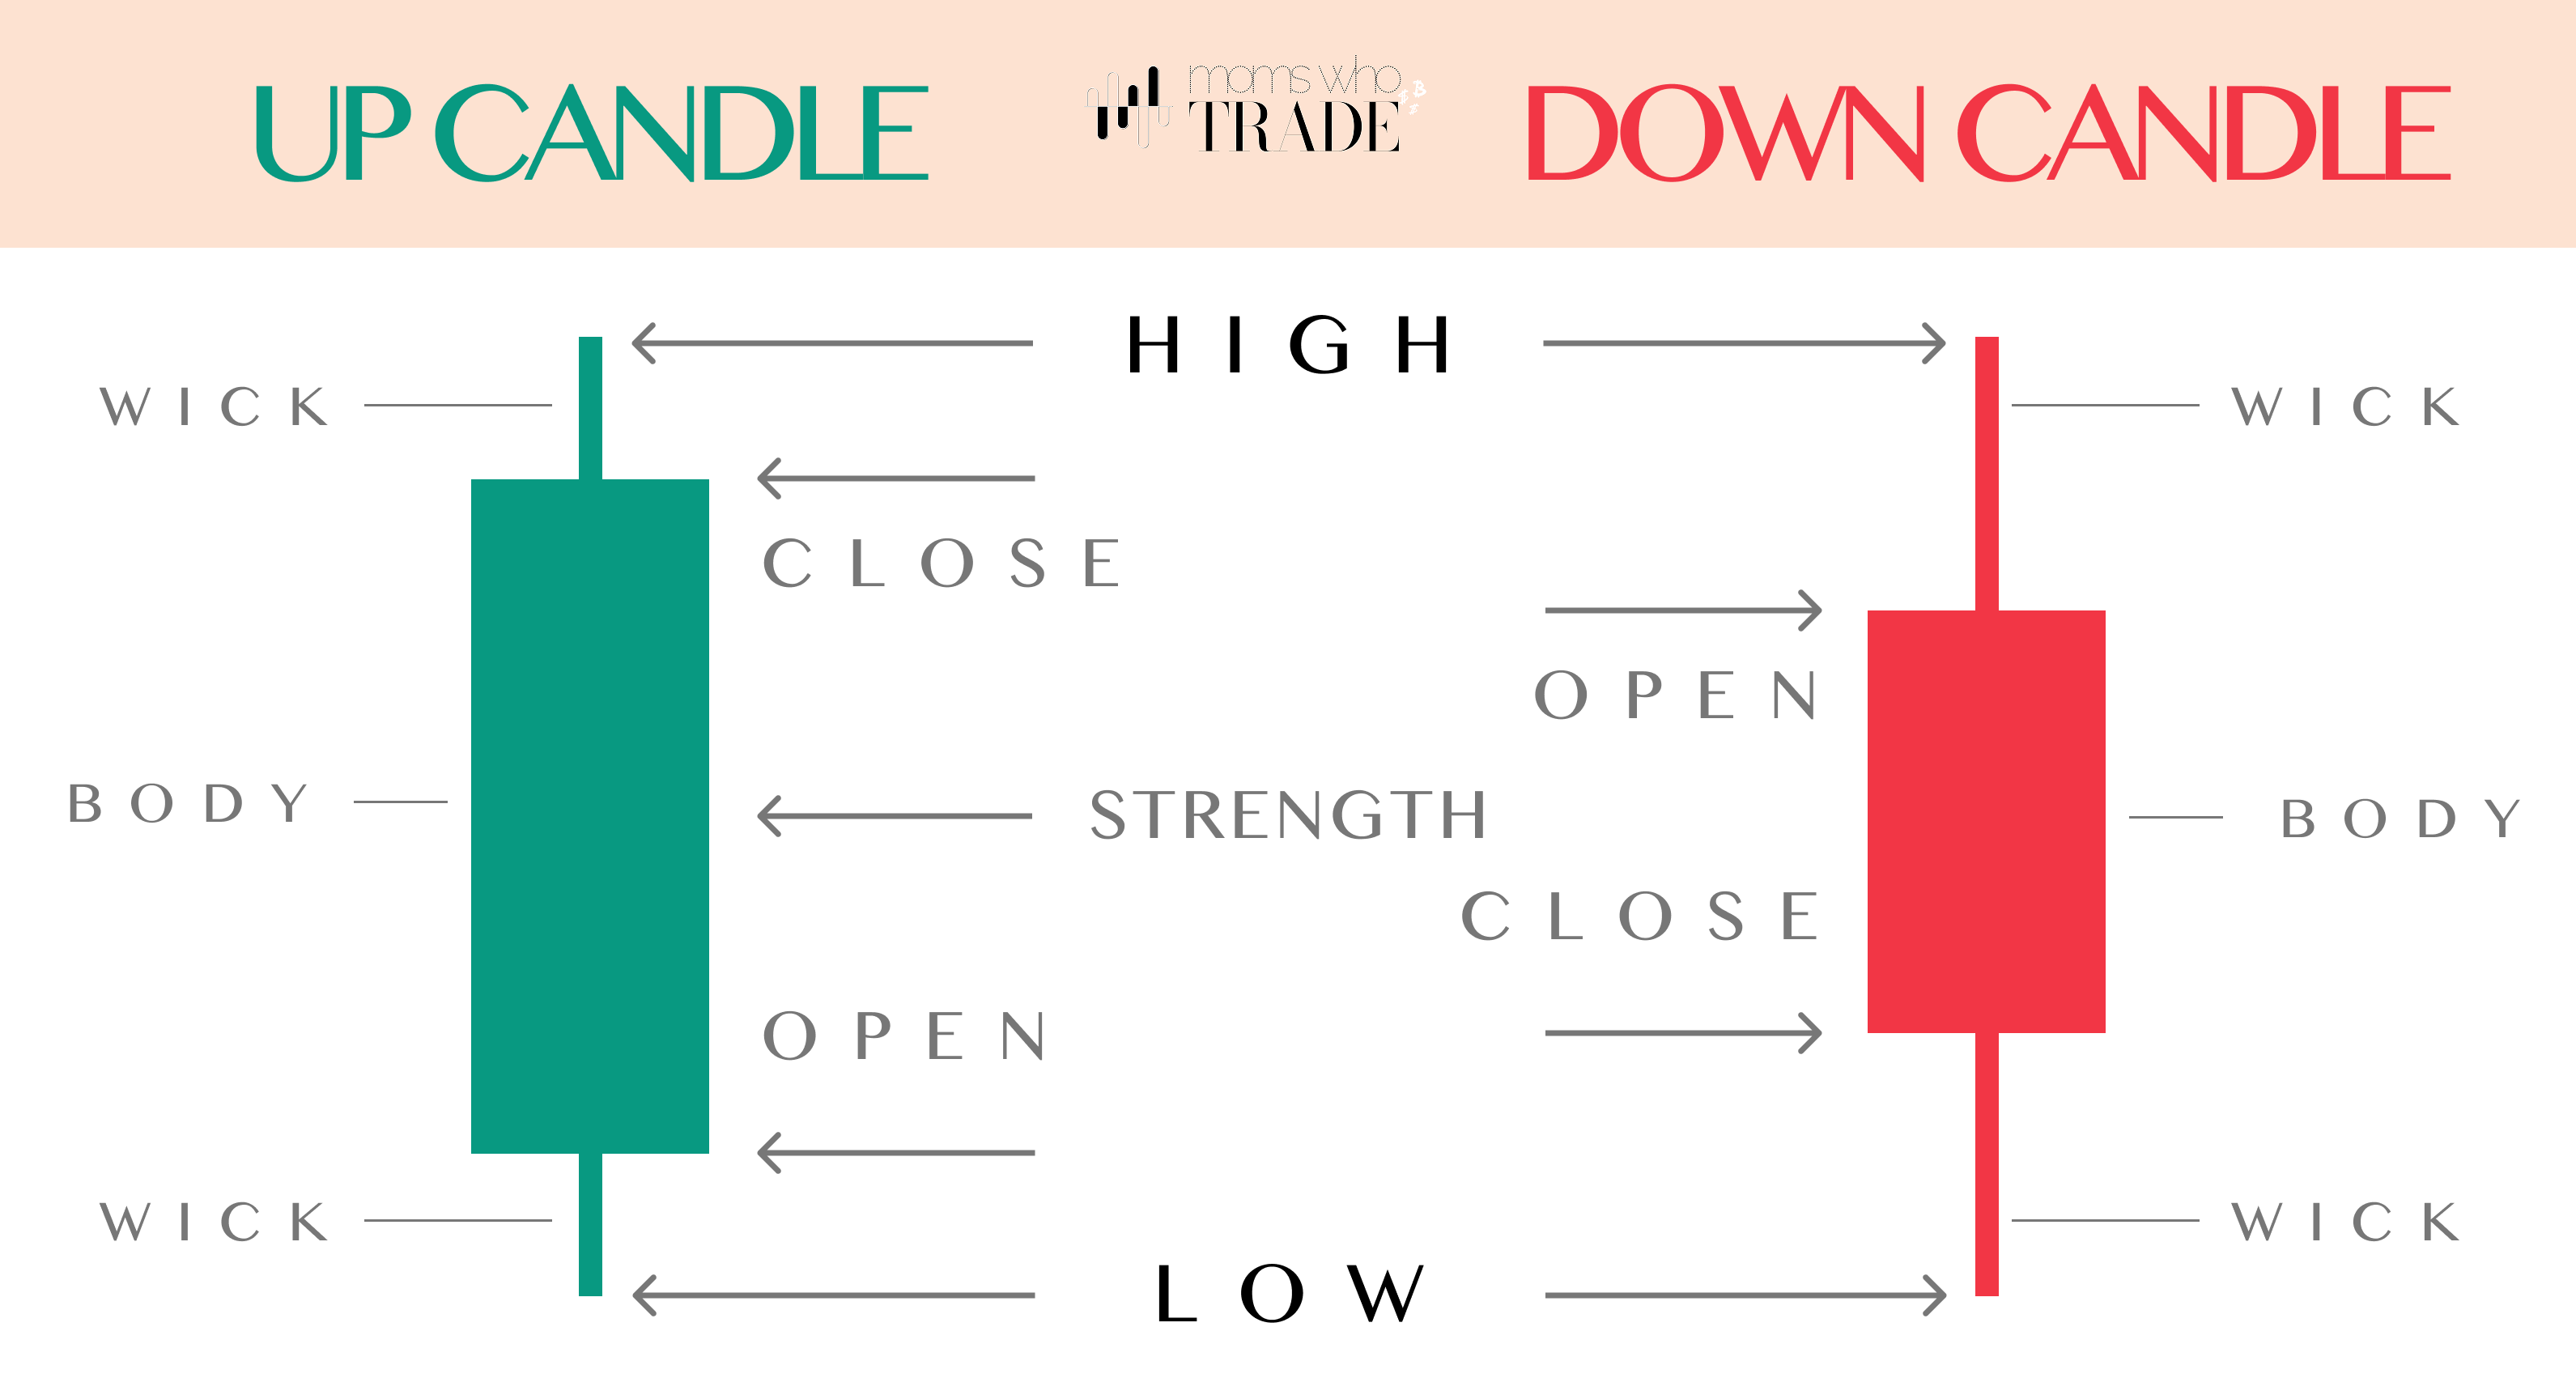
Each candle tells you five things: where the price opened, where it closed, the highest it went, and the lowest it went - all within one time period.
The fat part in the middle is called the body. That shows the open and the close. The thin lines sticking out the top and bottom are called wicks - those show the high and the low.
Green / up candle = the price went up during that period. The buyers won that round.
Red / down candle = the price went down. The sellers won.
Think of each candle as a tug of war, buyers on one end and sellers on the other. The body shows you how far one side dragged the other.
A long, fat body means one team dominated - barely a contest. They dragged the rope far. A short body means both sides were roughly equal. They yanked back and forth but ended up almost where they started. That's indecision sitting right there on the chart.
And those wicks? They show you how far each side tried to pull before getting yanked back. A short body sitting at the top of a long wick tells a different story than a short body sitting in the middle. The body and the wicks work together; that's how you read what actually happened. When you see a bunch of green candles in a row, the buyers are in control - that's your uptrend. A run of red candles? The sellers have taken over.
It's not random. It's a story. And now you can read it.
We'll get deeper into candle patterns in a future lesson. For now, just knowing green vs red, body vs wick, and long vs short puts you ahead of where most people start.
Timeframes: Zooming In and Out
Every candle on a chart represents a specific period of time. And you get to choose how long that period is.
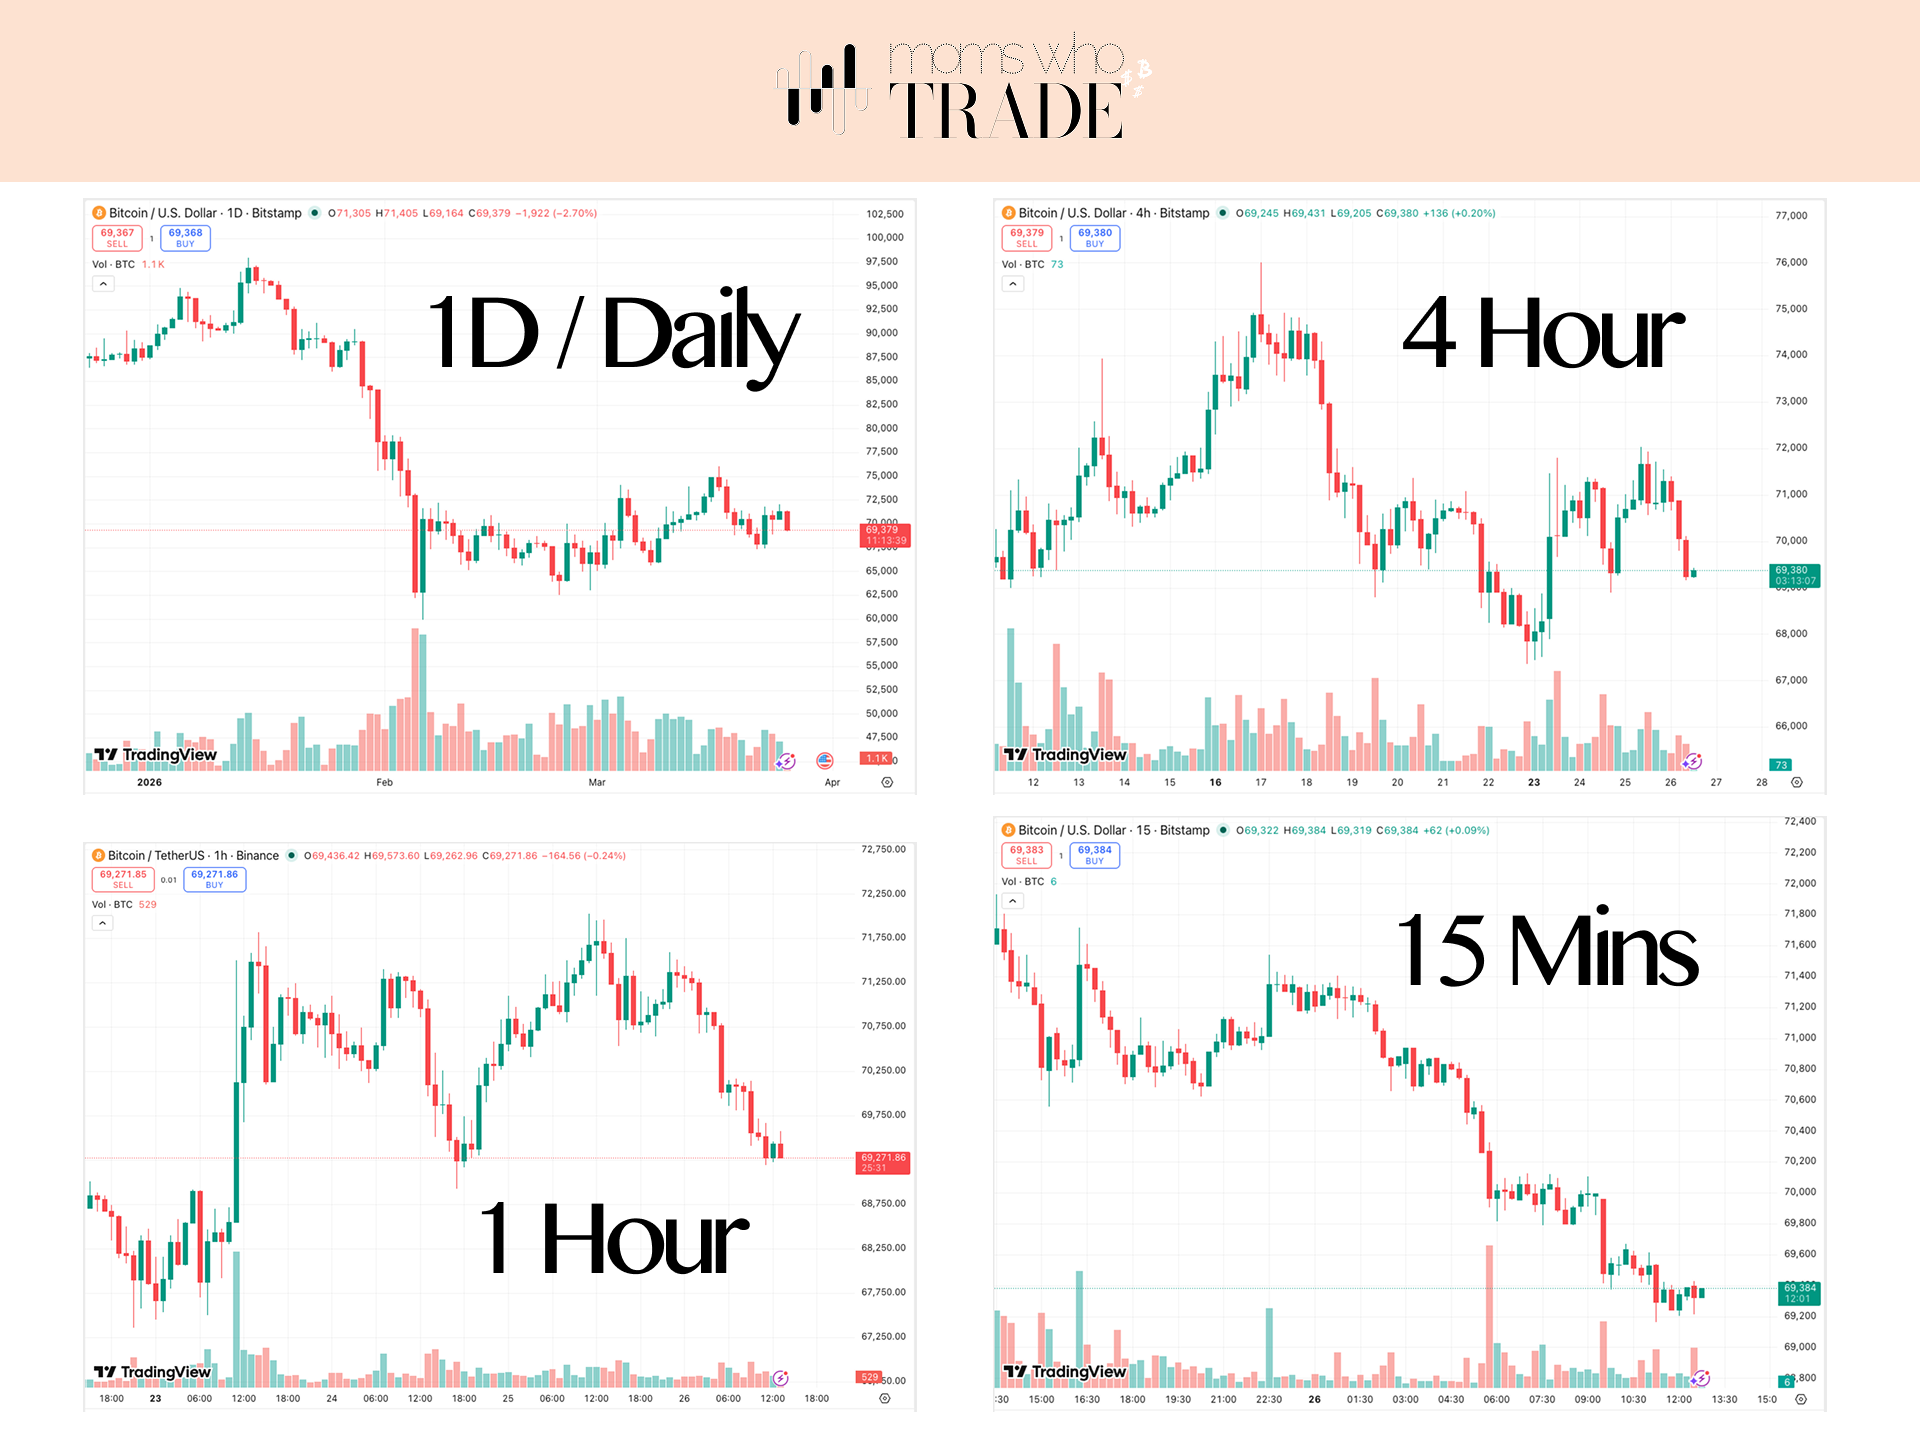
On a "1-hour chart", each candle shows the battle between buyers and sellers over one hour. On a 4-hour chart, each candle covers four hours. On a daily chart, each candle is one full day of price action.
This matters because the same chart can look completely different depending on which timeframe you choose. A daily chart gives you the big picture - the overall trend over weeks or months. An hourly chart zooms in and shows you the smaller moves happening within that bigger trend.
It's like looking at a map of a whole country vs zooming into one city. Same place, different level of detail. The country view tells you which direction you're heading. The city view tells you which street to turn on.
When you're starting out, stick to the higher timeframes - daily or 4-hour. They're slower, calmer, and easier to read. The lower timeframes move fast and can be overwhelming when you're still learning to read candles. There's no rush to zoom in.
Trends: How Price Moves
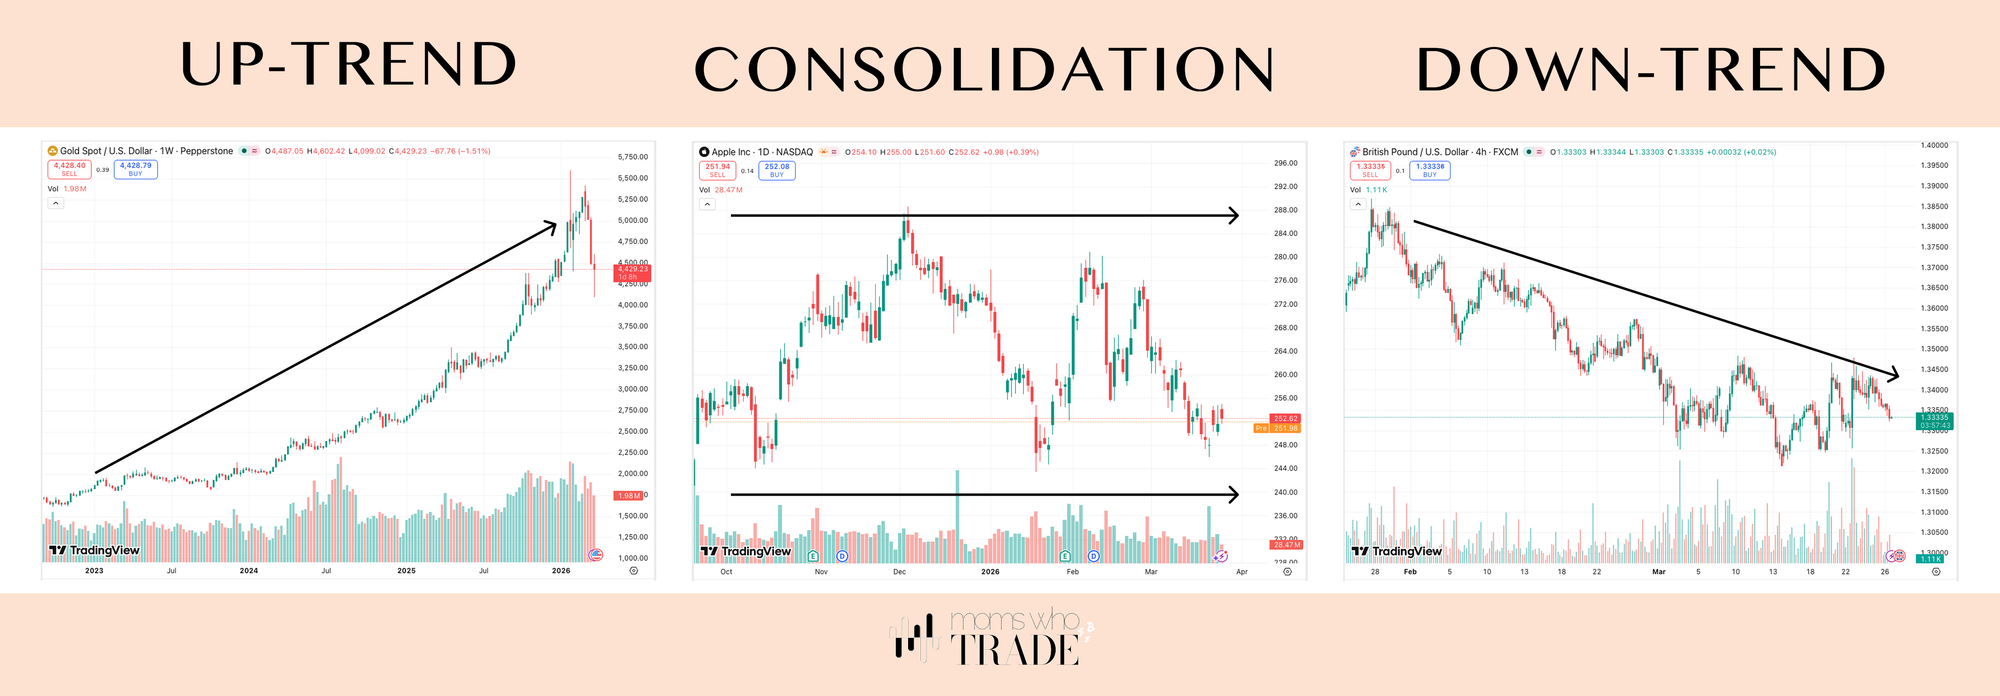
Price doesn't just jump around randomly. It tends to move in a direction, and that direction is called a trend.
An uptrend is when the price is generally going up. You'll see it making higher highs and higher lows, like climbing stairs.
A downtrend is the opposite. Price keeps making lower highs and lower lows, like going down a slide.
And sometimes, the price just moves sideways. Nobody's winning, nobody's losing. This is called consolidation - the market is basically taking a breather.
The simplest rule in trading: trade in the direction of the trend. If price is going up, you want to be buying. If it's going down, you want to be selling. Don't fight the market.
You don't need to predict the future. You just need to see which direction the river is flowing, and swim with it, not against it.
What You Just Learnt
Markets are just buyers and sellers - you already understand them. Trading is buying low and selling high. A chart shows you price over time. Trends tell you which direction to trade. And candles show you who's winning the battle.
That's the foundation. Everything else we learn builds on top of this.
In our next lesson, I'm going to walk you through placing your first practice trade. No real money, just practice. It's coming soon.
You've got this.
💚 Mel
← Lesson 03: Tools for the Trade · Next up: Lesson 05: Setting Up TradingView → Start Here