GOLD: Trade Notes + Beginner's Guide

06/08/2026
Back in April, we looked at Gold together. It had dropped, bounced, and we drew a line in the sand. I said if price fell back below a certain level, the recovery was in trouble.
Here we are in August. Price fell below that level, kept going, and never looked back.
And that's the whole point of what we do here. You don't predict the future. You pick your levels in advance, you watch how price behaves around them, and you respect what it tells you. So let's do it again, right now, and see what Gold is saying next.
Why Is Gold Worth Watching?
Gold is the oldest safe haven in the world. When things feel shaky, money has run to it for thousands of years. So when a chart this important falls this far from a record high, it's worth paying attention to what it does next.
The Big Picture (Current Price Action)
Open the daily chart and read the shape from left to right.
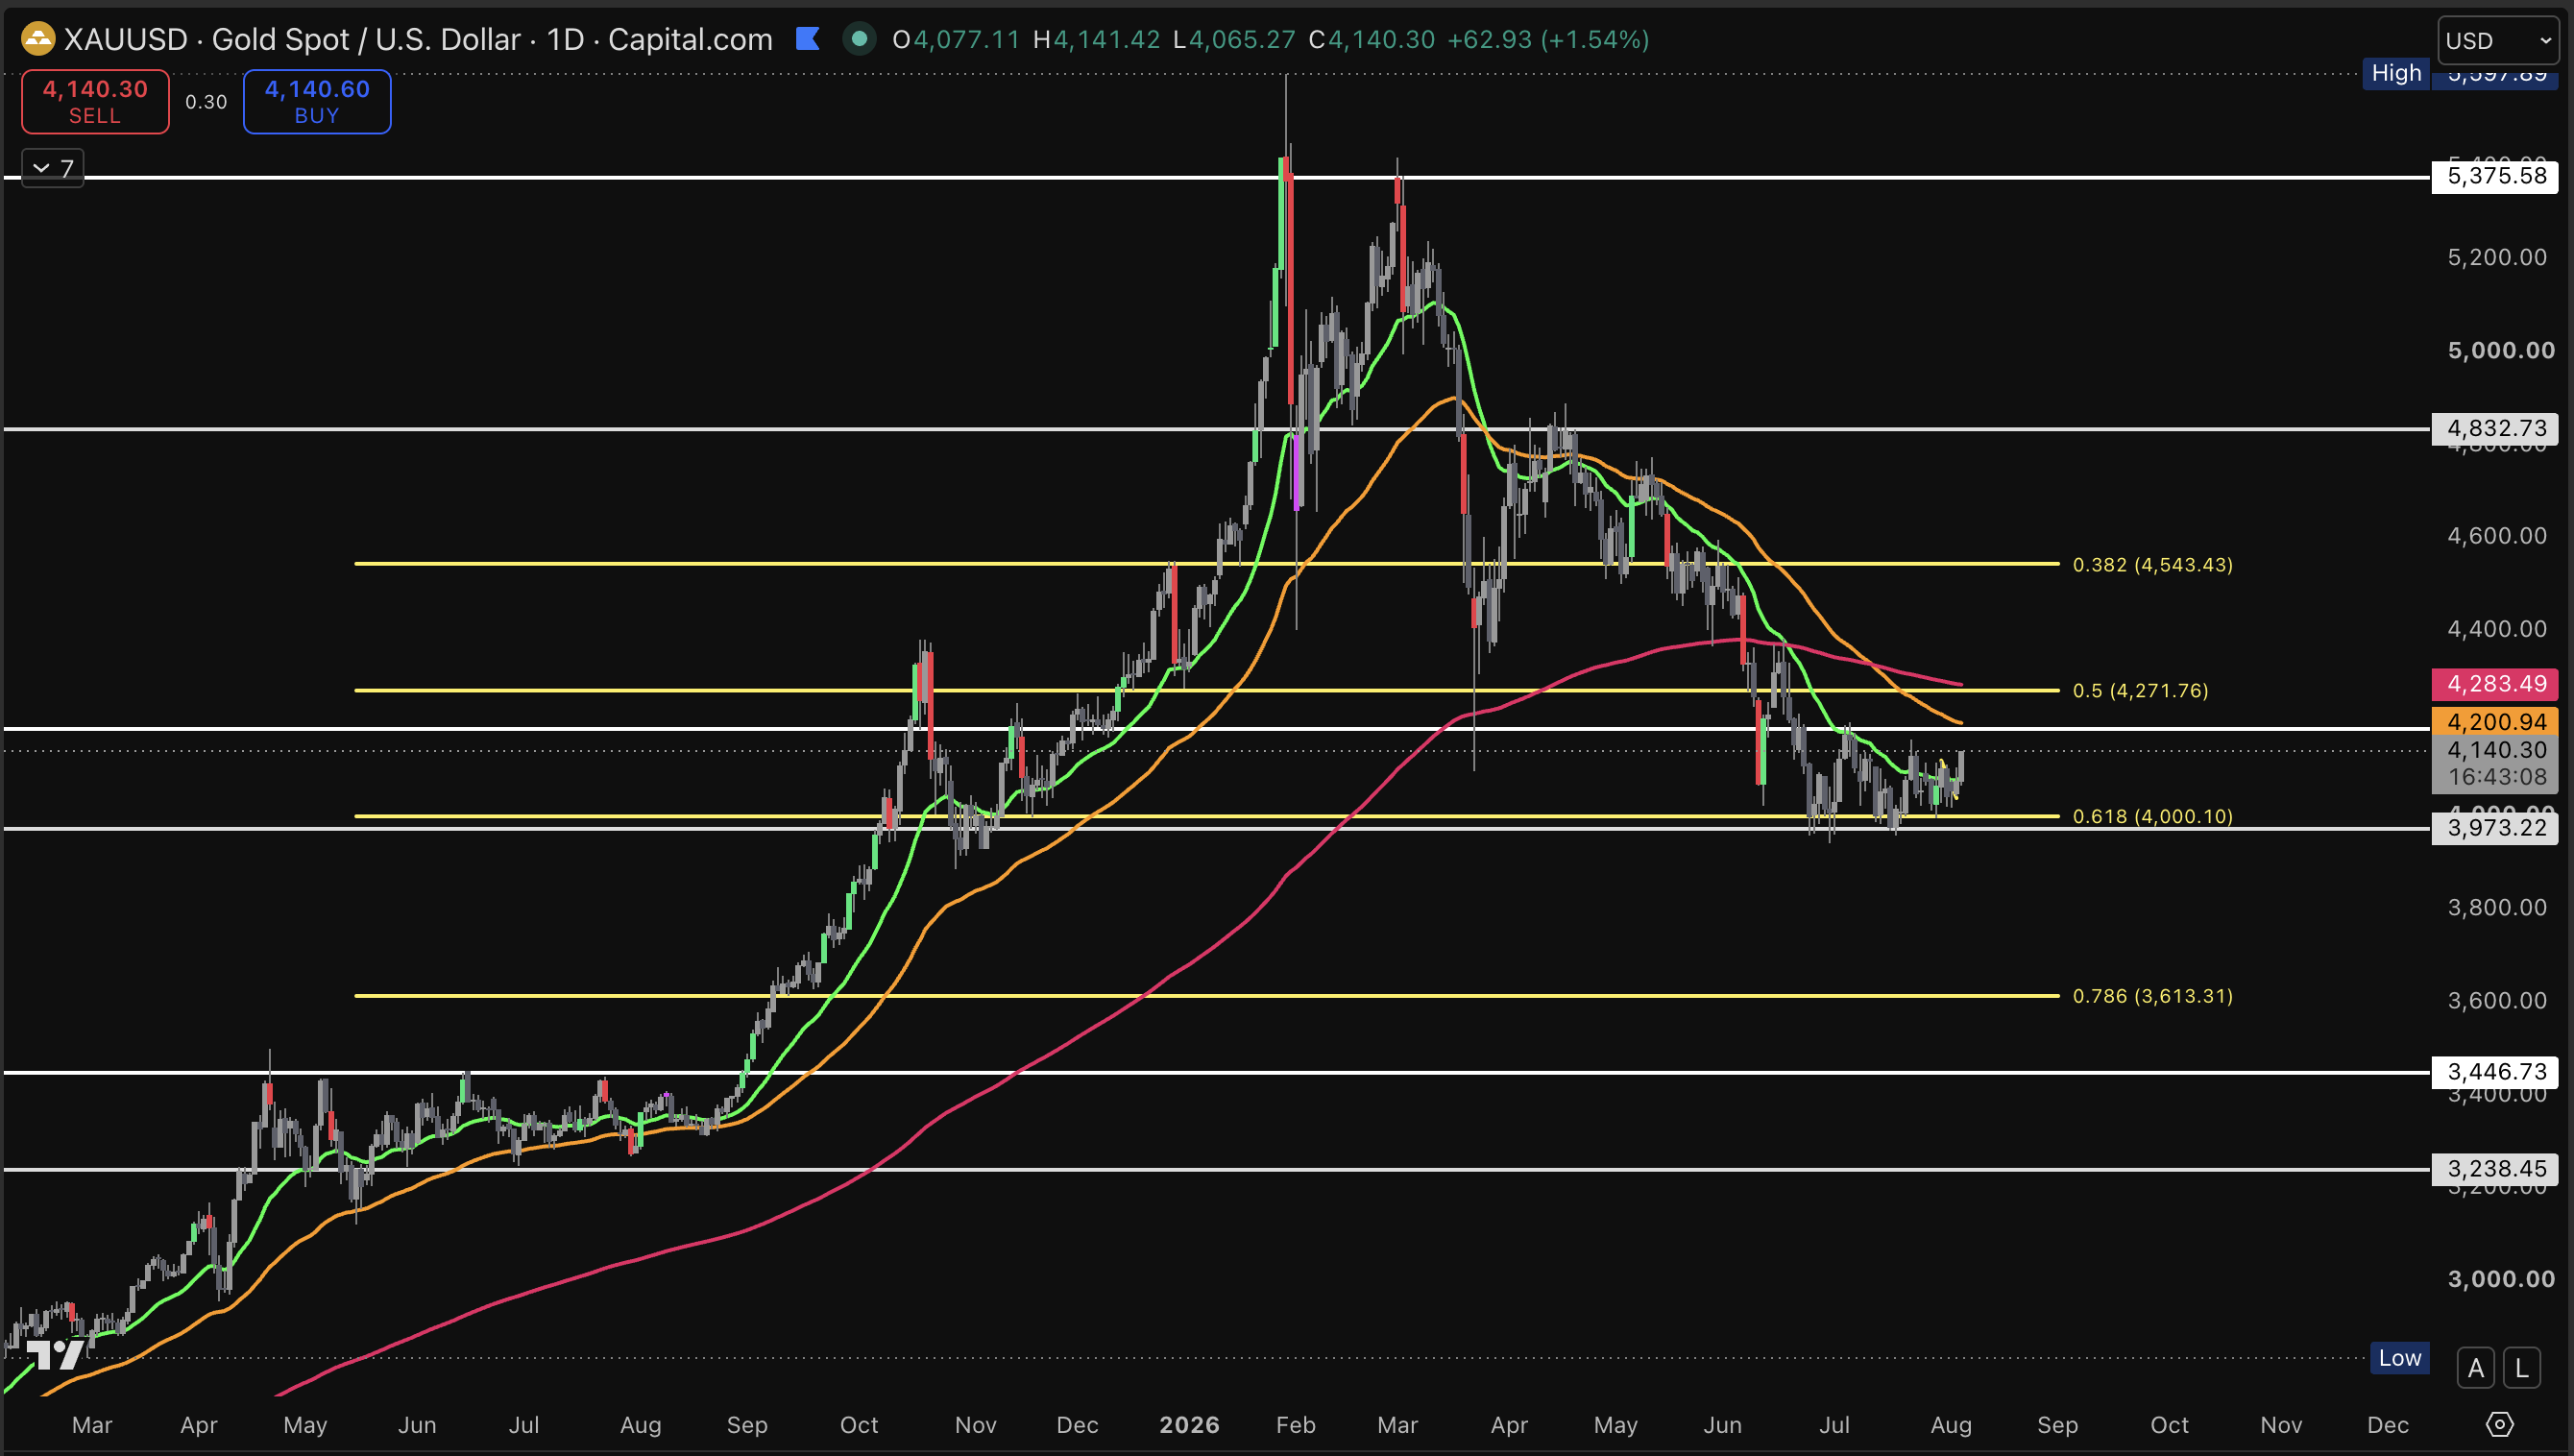
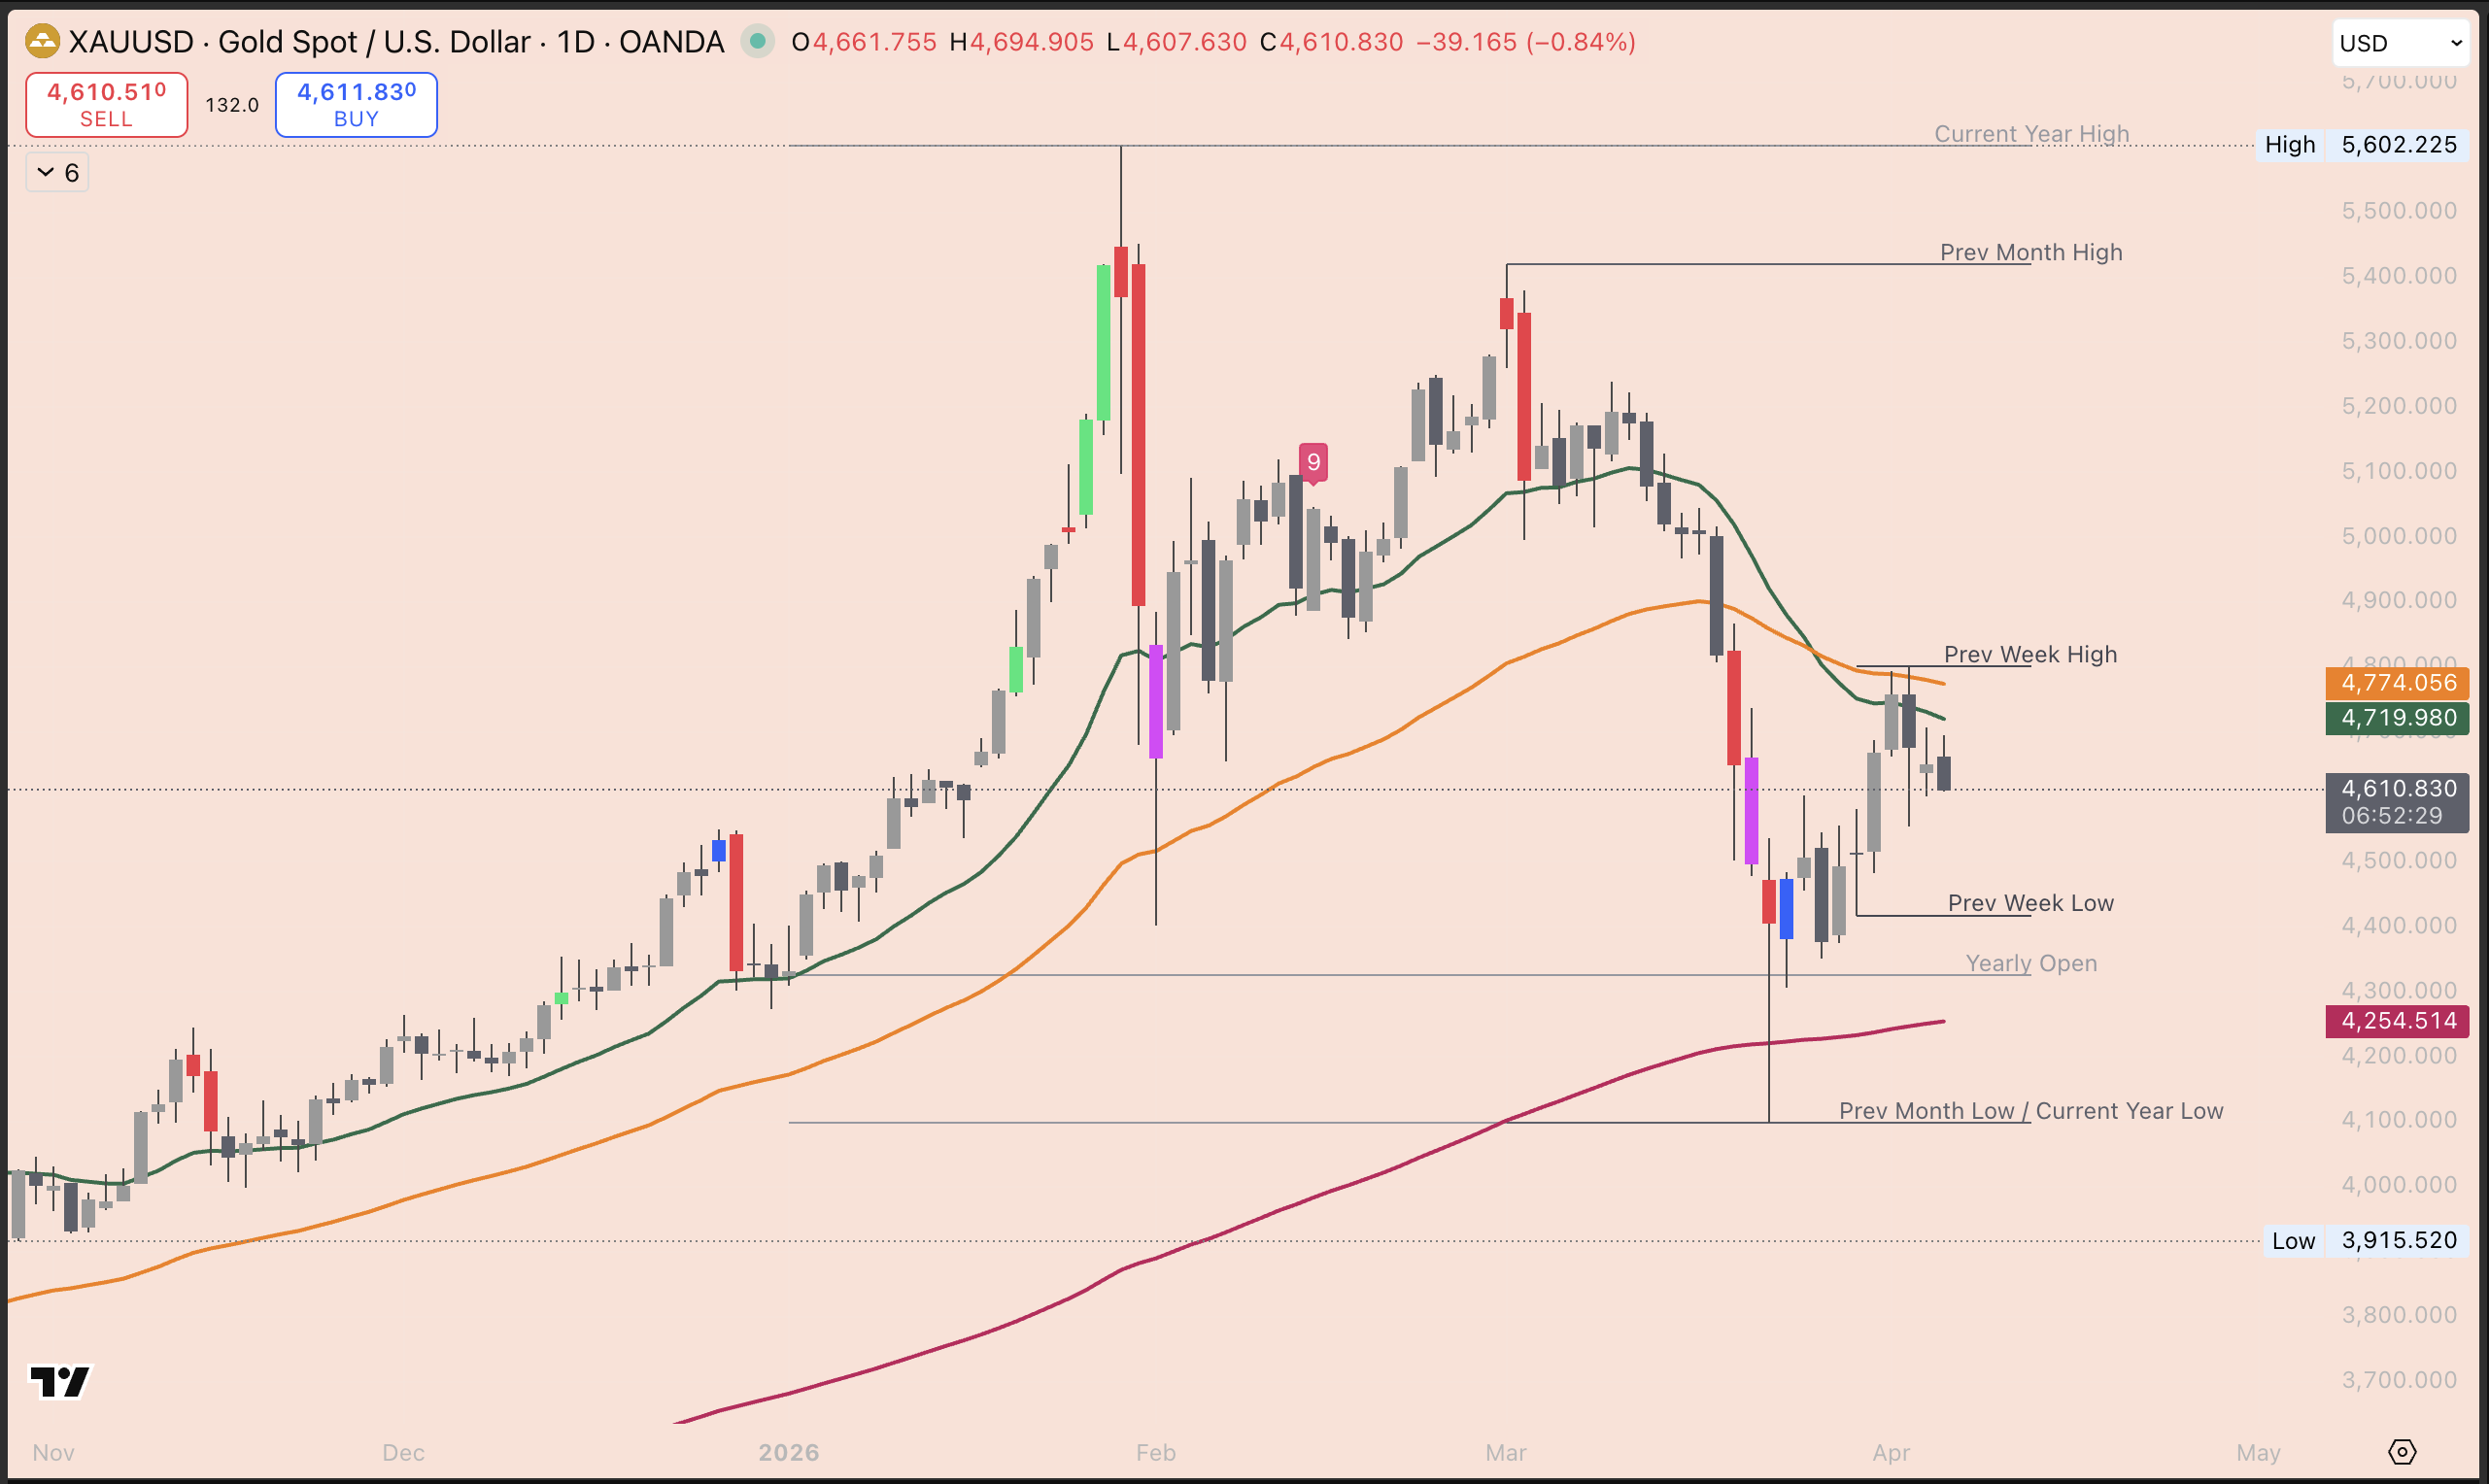
Through 2025, Gold climbed beautifully, all the way to a record high at the start of this year. Then it topped out. Since then, look at the pattern of the move. Each bounce has made a lower high than the one before, and each dip a lower low. That's a staircase, and it's stepping down.
That's a downtrend, and it's the single most important thing on this chart. The big red moving average, the one that shows the long-term direction, is sitting above the price and pointing down. That tells us which way the current is flowing, and right now it's flowing down.
Key Levels (The Floors and Ceilings)
Now drop to the 4H, because this is where the real story is right now.
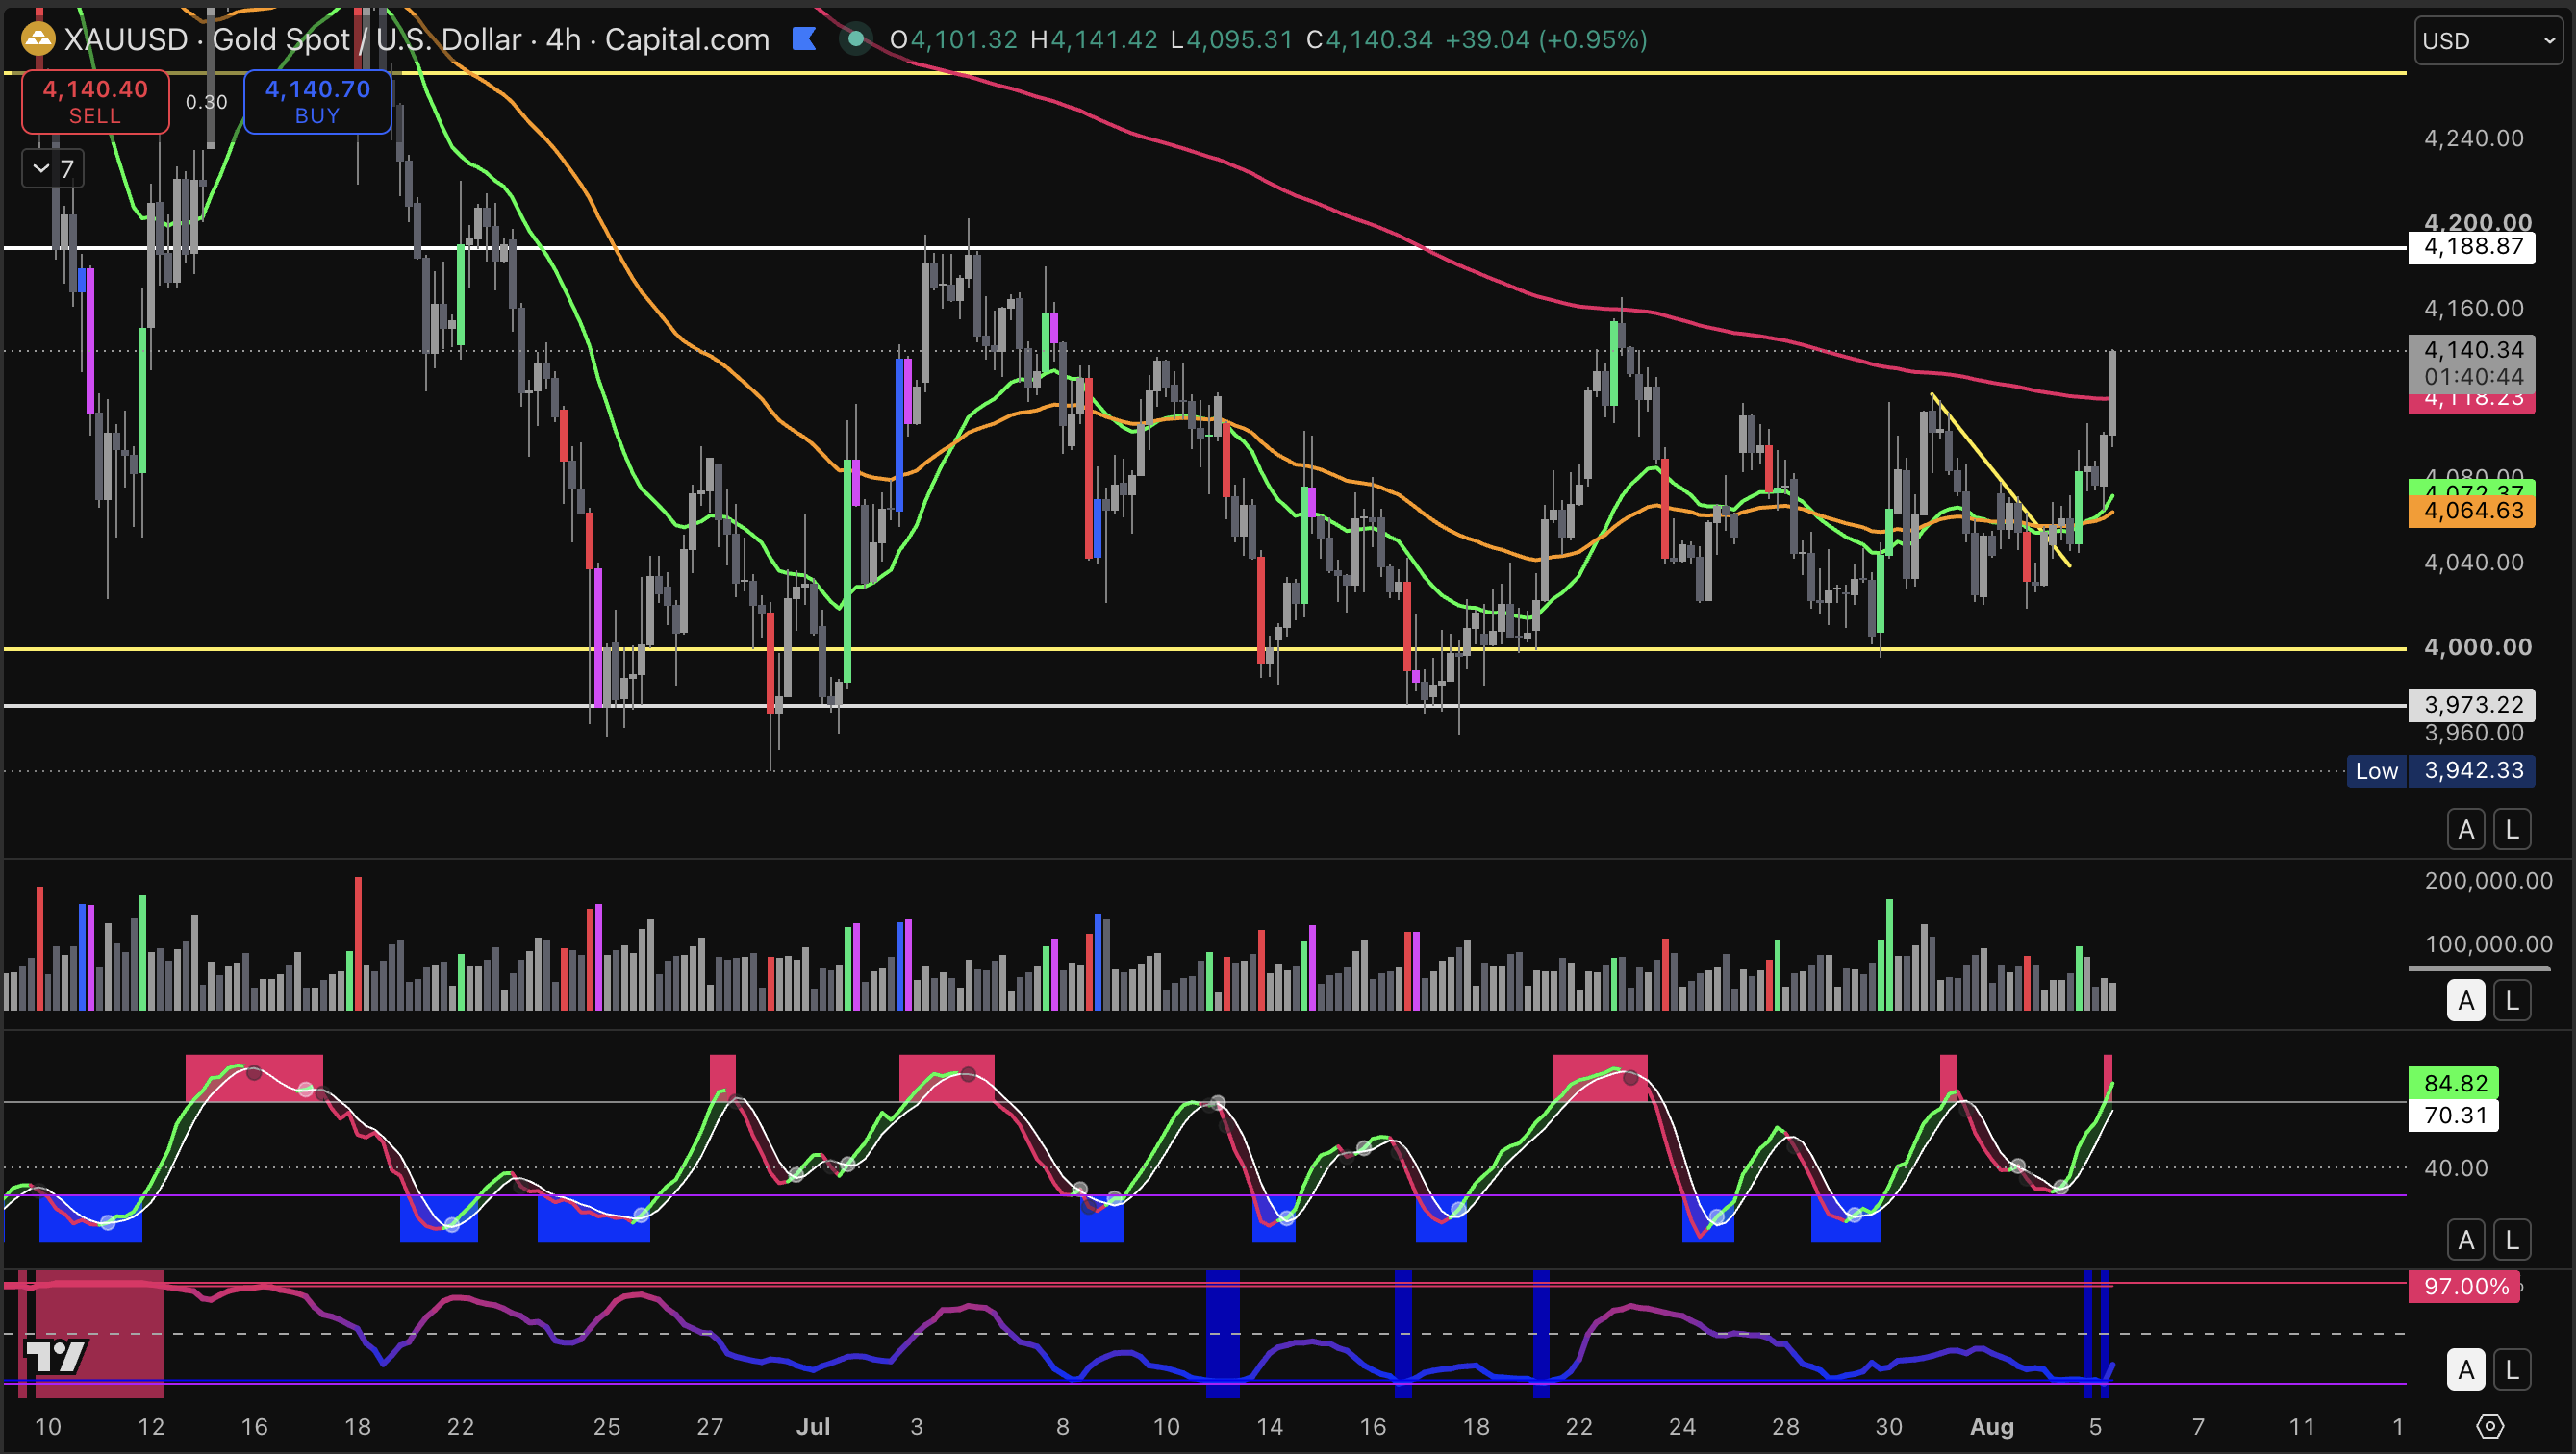
Gold has been trapped between two levels for weeks. There's a floor around $3,900 that buyers keep defending, and a ceiling around $4,200 that sellers keep knocking it back from. Price bounces off the floor, drifts up to the ceiling, gets pushed back down, and returns to the floor. Over and over.
Right now, price has just bounced off the floor and is drifting up again. That is not a trade. Buying in the middle of the room, with no idea which wall breaks next, is exactly how beginners get chopped up. We wait for one of the walls to give way.
Technical & Global Vibe Check
Before I ever consider a trade, I check two things: what the world is doing, and what the chart is doing. Let's do both.
Start with the world. Remember the Oil posts, and the conflict in the Middle East? That same story runs straight through Gold. The conflict pushed energy prices up. Higher energy pushed inflation up. And when inflation runs hot, the people who set interest rates tend to raise them. Here's why that matters for Gold: it pays you nothing to hold. No interest, no dividend. So when rates rise and you can earn a safe return just leaving your money in the bank, metal that pays nothing suddenly looks less attractive. Money rotates out of it. Add a stronger dollar on top, which makes Gold more expensive for the rest of the world, and you've got the engine behind a drop of around a quarter from the highs. Oil, inflation, rates, the dollar, Gold. They all hold hands, which is exactly why the dollar sits at the top of our watchlist.
Now the chart.
Momentum: The Speedometer (Stochastic)
Momentum is your speedometer. It tells you how much energy is behind a move and where price sits in its cycle, from oversold down at the bottom to overbought up at the top. And it has just swung hard. Over the last few sessions the needle raced from the bottom of the range all the way up into overbought, sitting up around 85.
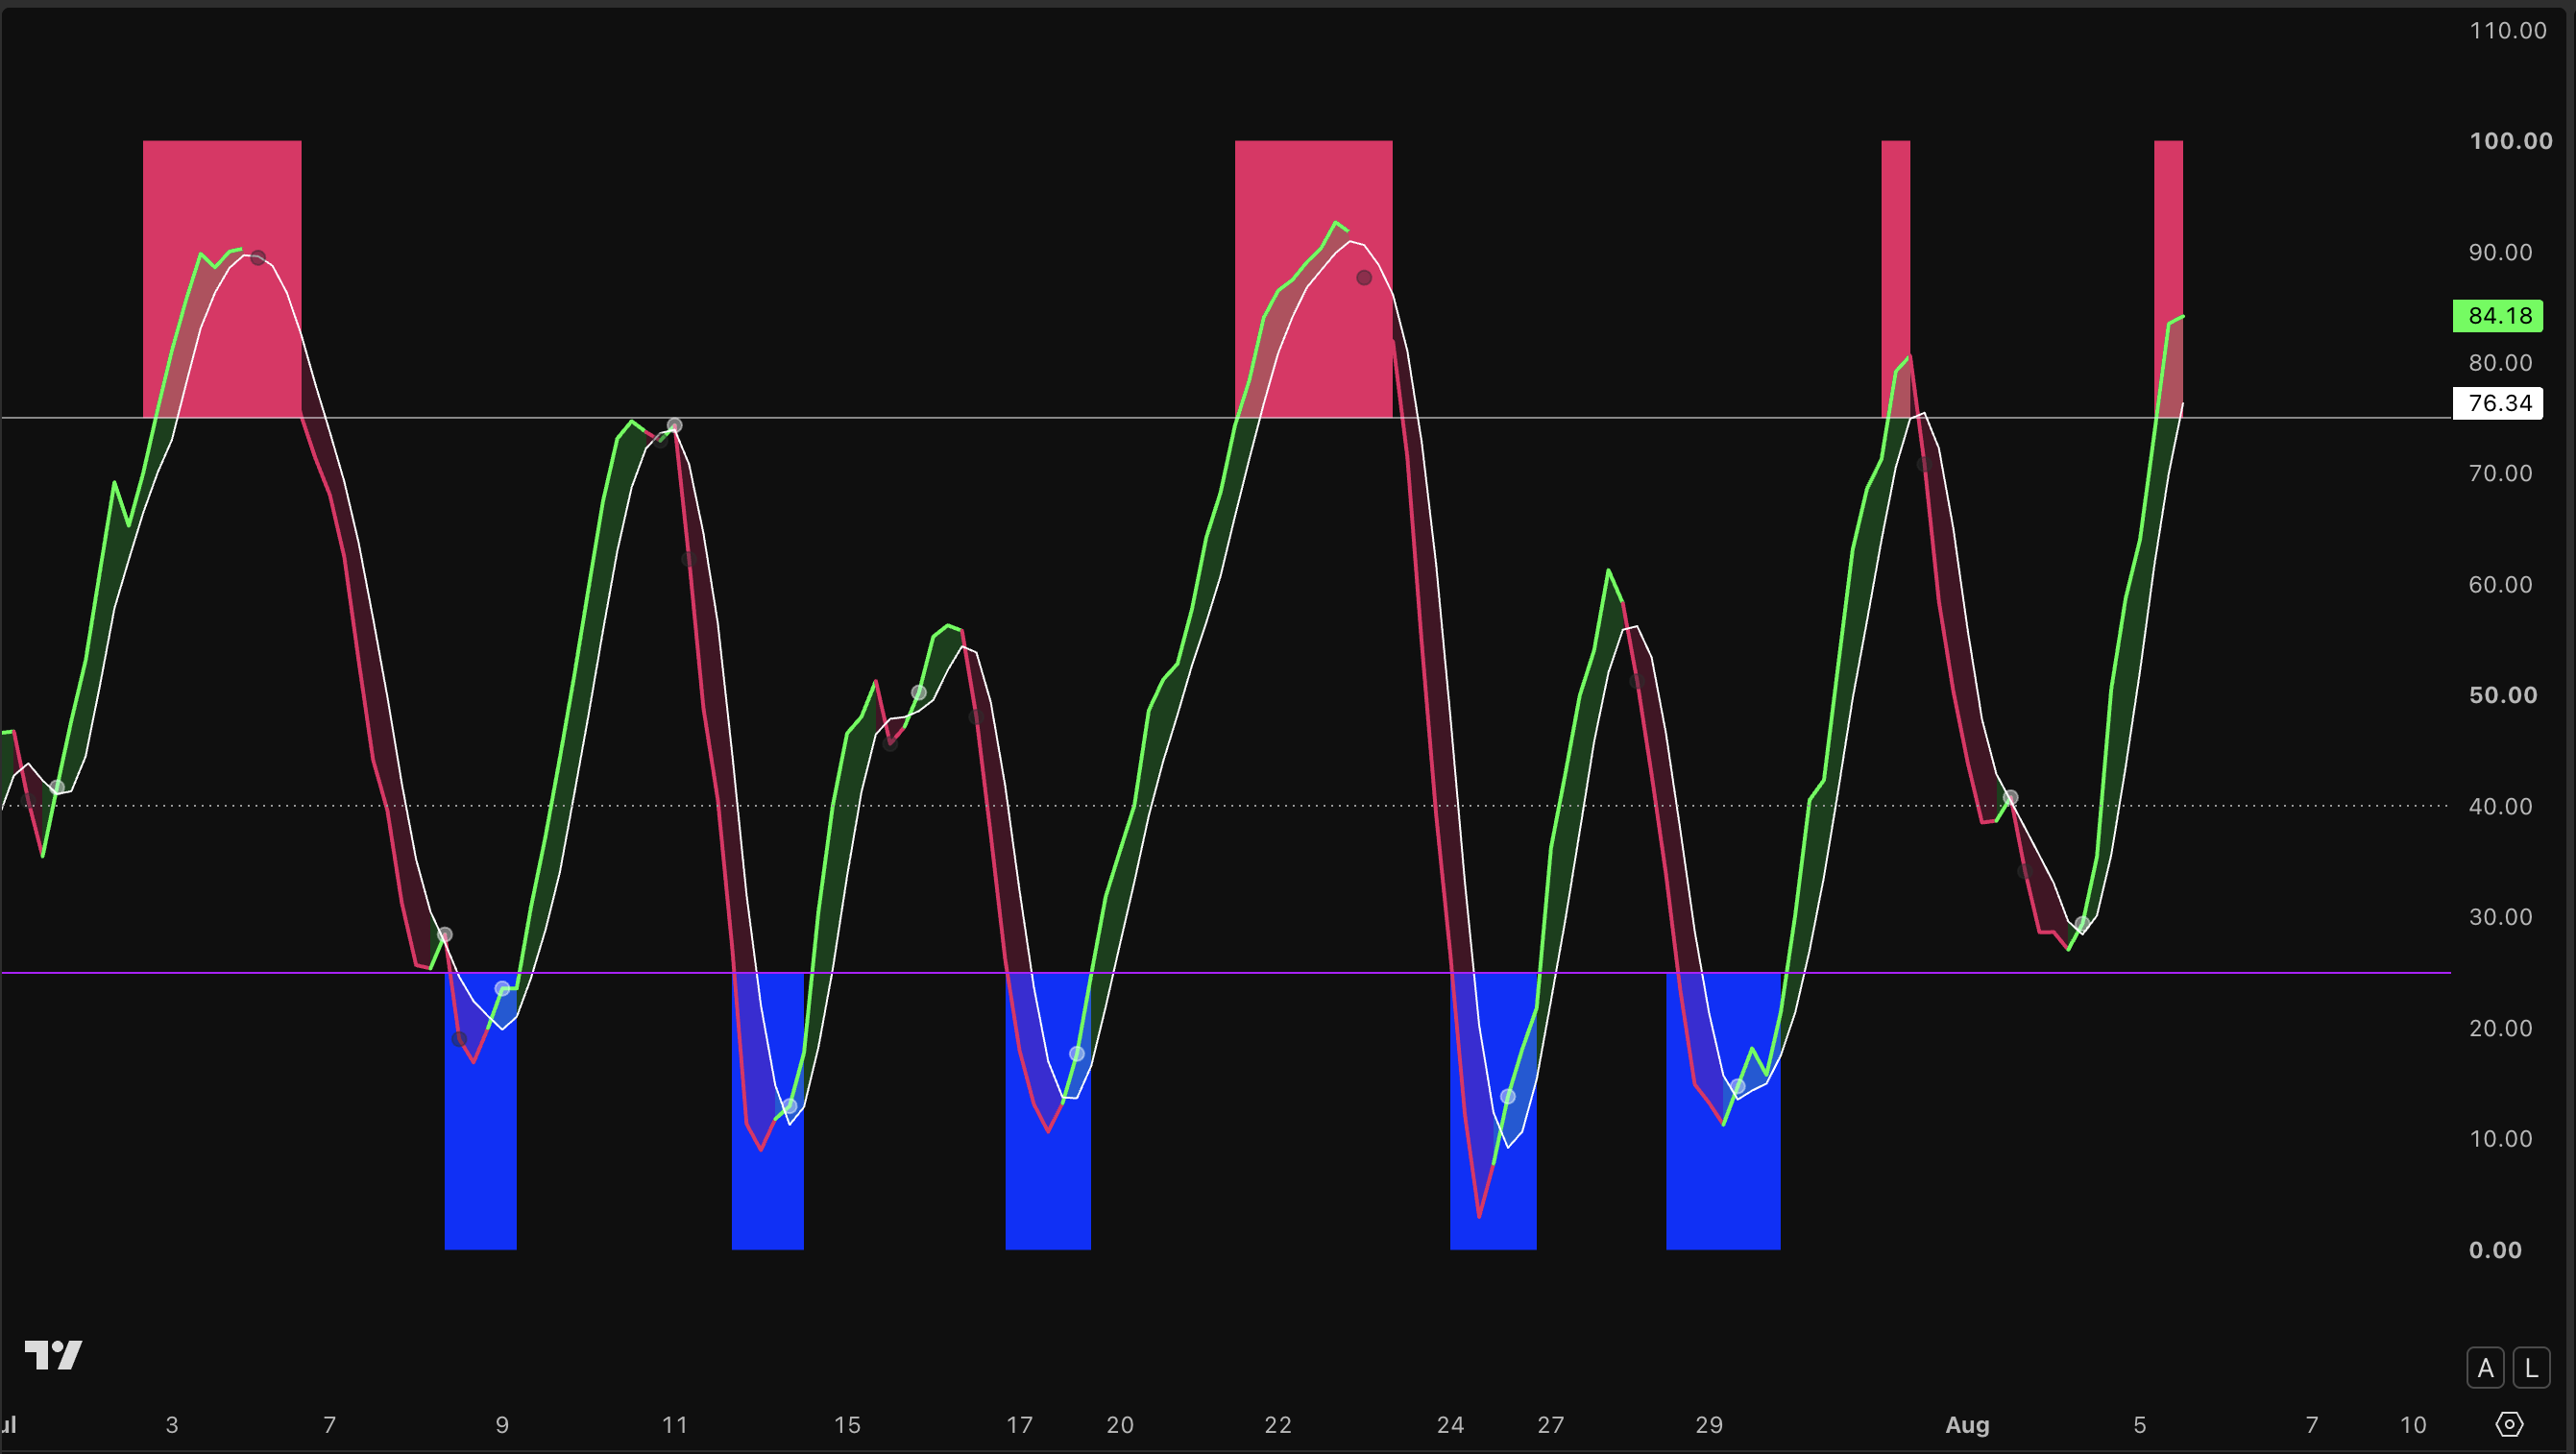
So this bounce has real energy behind it, no question. But here's the catch. When momentum is this stretched near the top, most of the move is behind us, not ahead. The tank is running low. And it's arriving overbought right as price reaches that ceiling, which is exactly where sellers tend to think about stepping back in. That makes this a late place to chase, not an early place to enter.
Volatility: The Weather Report (BBWP)
Volatility is your weather report, and it has just started to change. For weeks the BBWP at the bottom of the chart was pinned right down near its lowest level, dead quiet. That kind of stillness isn't calm and safe. It's a storm building, energy coiling like a spring being wound tighter and tighter.
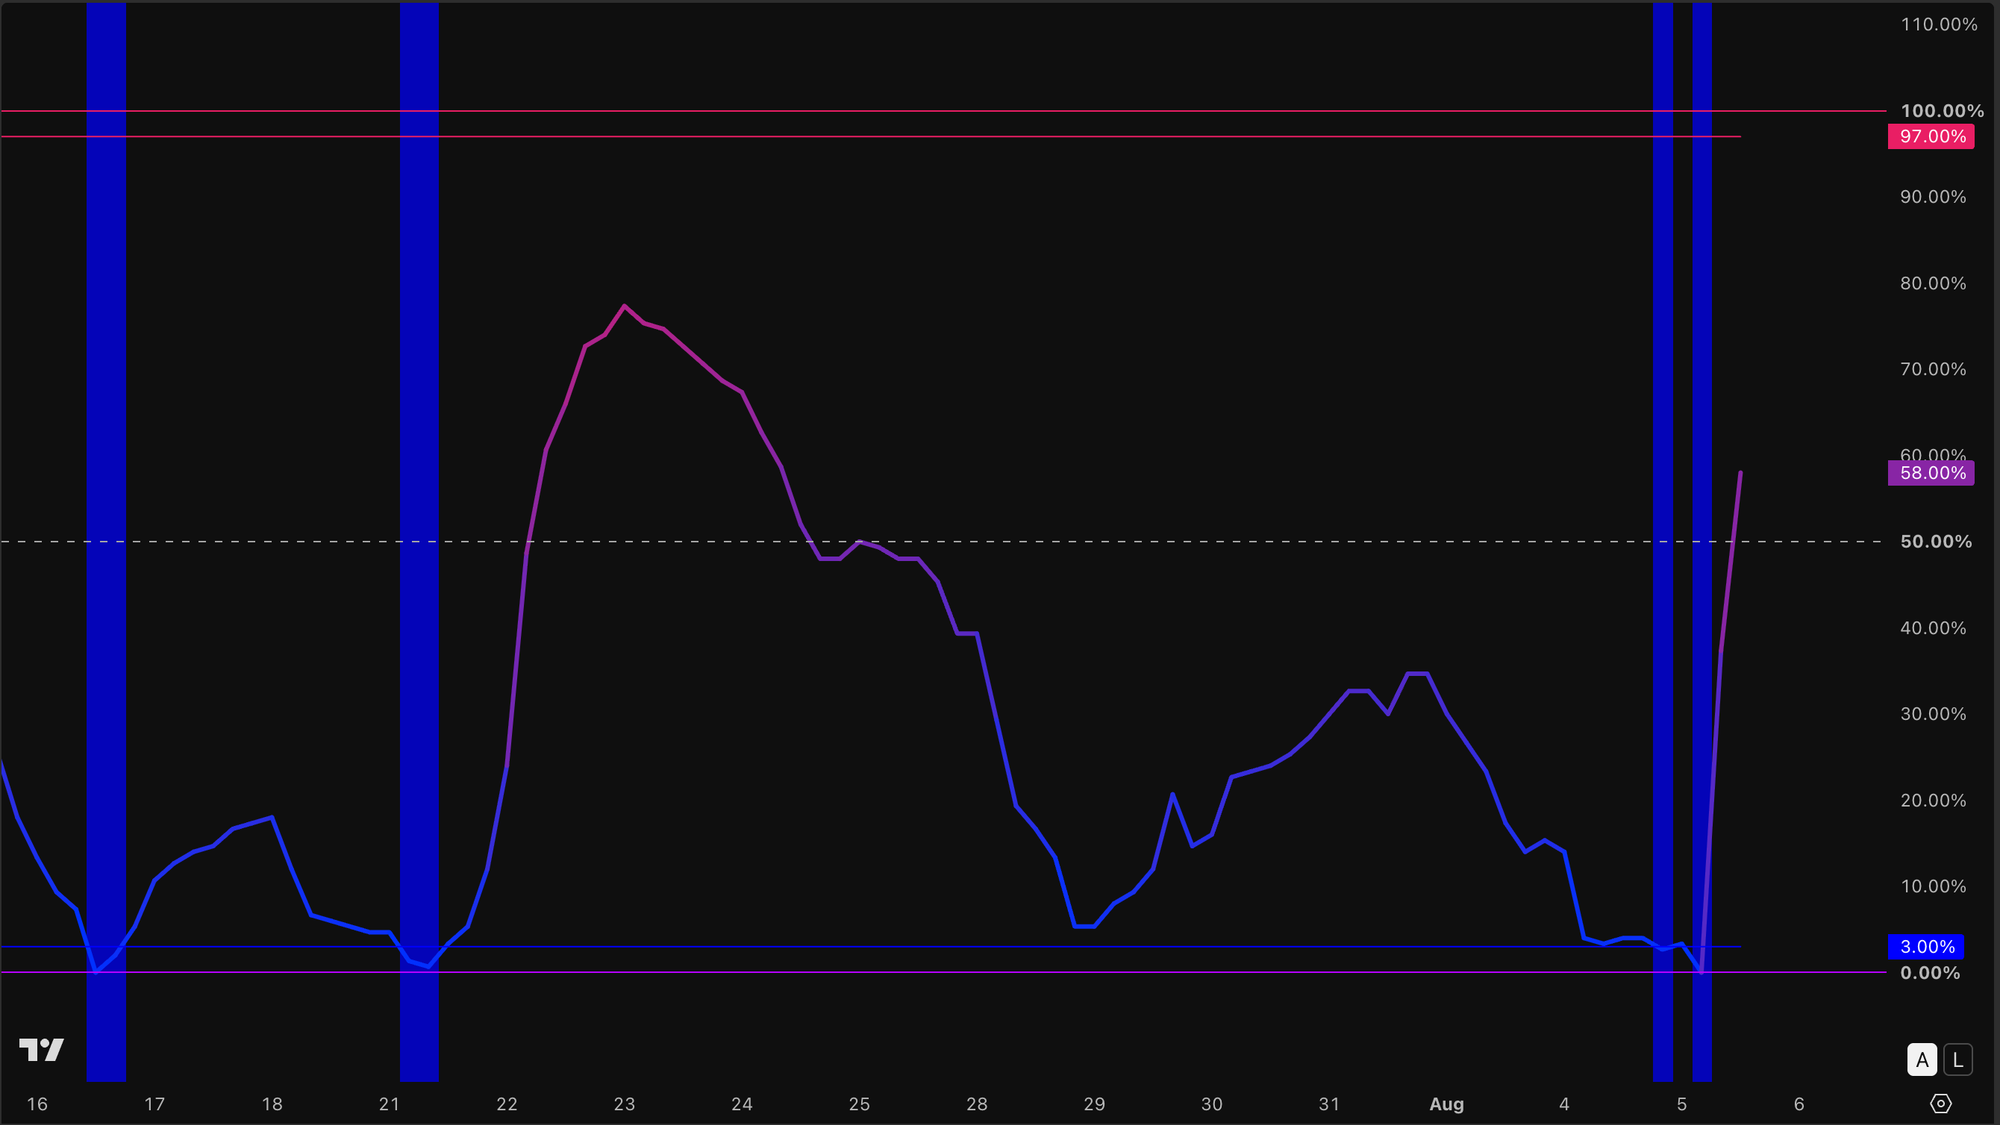
Well, the spring has started to release. You can see the reading lifting off the floor as this move gets going. The quiet is breaking, and that's usually your sign the market has finally picked a direction to spend all that stored energy. For now, it's spending it to the upside.
And the trend? Zoom out, and even with today's pop, the bigger picture is still pointing down. Now, a downtrend isn't a bad thing. We're not only ever looking to buy. We're looking for trades, and a trade can go either way. A downtrend simply tells us that if a clean setup appears, the odds favour a short over a long, and a bounce arriving overbought right at a ceiling is exactly the kind of spot where sellers like to look. We follow the direction the chart gives us. We don't fight it.
Put it together, and the method says the same thing. This is a watching post, not a touching post. The story is huge. The spring has released, and price is now right at the decision point. But the clean, confirmed trade, the kind we actually act on, hasn't shown itself yet.
Is This Worth Watching?
Absolutely. But watching is the word. There are two roads from here, and I'm watching both.
The short. If the $3,900 floor breaks and price stays below it, the downtrend continues and the door opens lower. The zone I'd be watching sits down around $3,400, stretching toward $3,300. I like that area because a few unrelated things line up there at once: an old ceiling that tends to flip into a new floor, a slow-moving average, and the price where the heaviest buying and selling has happened. When several reasons point at the same spot, that spot matters more. That's confluence. It's the difference between one stranger telling you a road is closed and three strangers all telling you the same thing.
The long. If price pushes up instead and closes convincingly above the $4,200 ceiling, that's the first real sign the sellers are losing their grip. That would put the $4,300 area in focus next, and hint the correction may be finding its bottom. Plenty of the big banks think Gold recovers later this year, but only if interest rates stop climbing. That's the "if" we're all watching.
Either way, that quiet volatility tells us the calm won't last. When one of these levels breaks, Gold is likely to move with real conviction.
Mom Tip: Watching doesn't mean sitting on your hands. Here's your exercise for the week, and it's the best way to build the skill. Remember the very first time we looked at Gold, when we drew support and resistance, added the Fib, and drew the trend line? Do all of that again now, on your own. Open Gold, start on the weekly or daily, and mark it up with your own eyes. Then decide where you think price is heading, and test it without risking a cent. Place a paper trade, or set a limit order where you think price will go, and see if it gets there. That's the whole point of paper trading. It lets you test your read against the real market, for free, and shows you exactly where your thinking is sharp and where it needs work.
New to trading Gold? Here are the questions I get asked most 👇
Frequently Asked
What is XAUUSD? It's simply the price of Gold measured in US dollars, and it's the chart most traders use to follow Gold. XAU is the market code for gold, USD is the dollar.
Why is Gold falling in 2026? Mainly because interest rates have been rising to fight inflation. Gold pays no interest, so when safer assets start paying more, money rotates out of Gold. A stronger US dollar has added to the pressure.
Is Gold a good asset for beginners to learn on? Yes. It tends to trend and respect its levels more cleanly than fast, newer assets, which makes it a lovely chart to practise reading support, resistance and trend on.
Does Gold always go up when there's fear in the world? Often, but not always. Fear pushes Gold up, but rising interest rates and a strong dollar can push it down at the same time. When those forces fight, the stronger one wins, which is exactly what we've seen this year.
Is it safe to trade Gold? No trading is risk-free. You lower the risk the same way every time. Paper trade first, only risk what you can afford to lose, cap every trade, and avoid leverage while you learn.
The content in this post is for educational purposes only and reflects our personal perspectives on the market. It is not financial advice. Always do your own research before making any trading decisions. We are sharing our ideas, not telling you what to do with your money.
🤍 Mel
07/04/2026
In Lesson 5 you set up your TradingView. You added the moving averages, configured your Fib, and got your chart looking the way we trade. Now let's use all of it on a live chart - for the very first time.
This is Gold. And right now, it's one of the most talked-about charts in the world.
Why Is Gold Moving?
Gold has always been where people run when the world feels uncertain. Wars, recessions, political chaos - money flows into gold when people don't know where else to put it.
Right now, the world has a lot of uncertainty. The US-Iran conflict has disrupted global oil supply. New trade tariffs are being announced almost weekly. Stock markets are shaking. And when all of that happens at once, gold tends to move - and move fast.
That's the news behind this chart. Keep that in mind as we look at what the candles are actually doing.
Open Your Chart
In TradingView, search for XAUUSD and select Gold Spot / U.S. Dollar from OANDA. Set your timeframe to 1D (daily) — we're starting zoomed out this time before we work our way in.
Start Here: Zoom Out to the Daily Chart
Before we look at anything else, we need to zoom out. Switch your timeframe to 1D (daily). Each candle now represents one full day, and from up here, the big picture becomes a lot clearer.
The first thing we do on any chart is find two things: support and resistance.
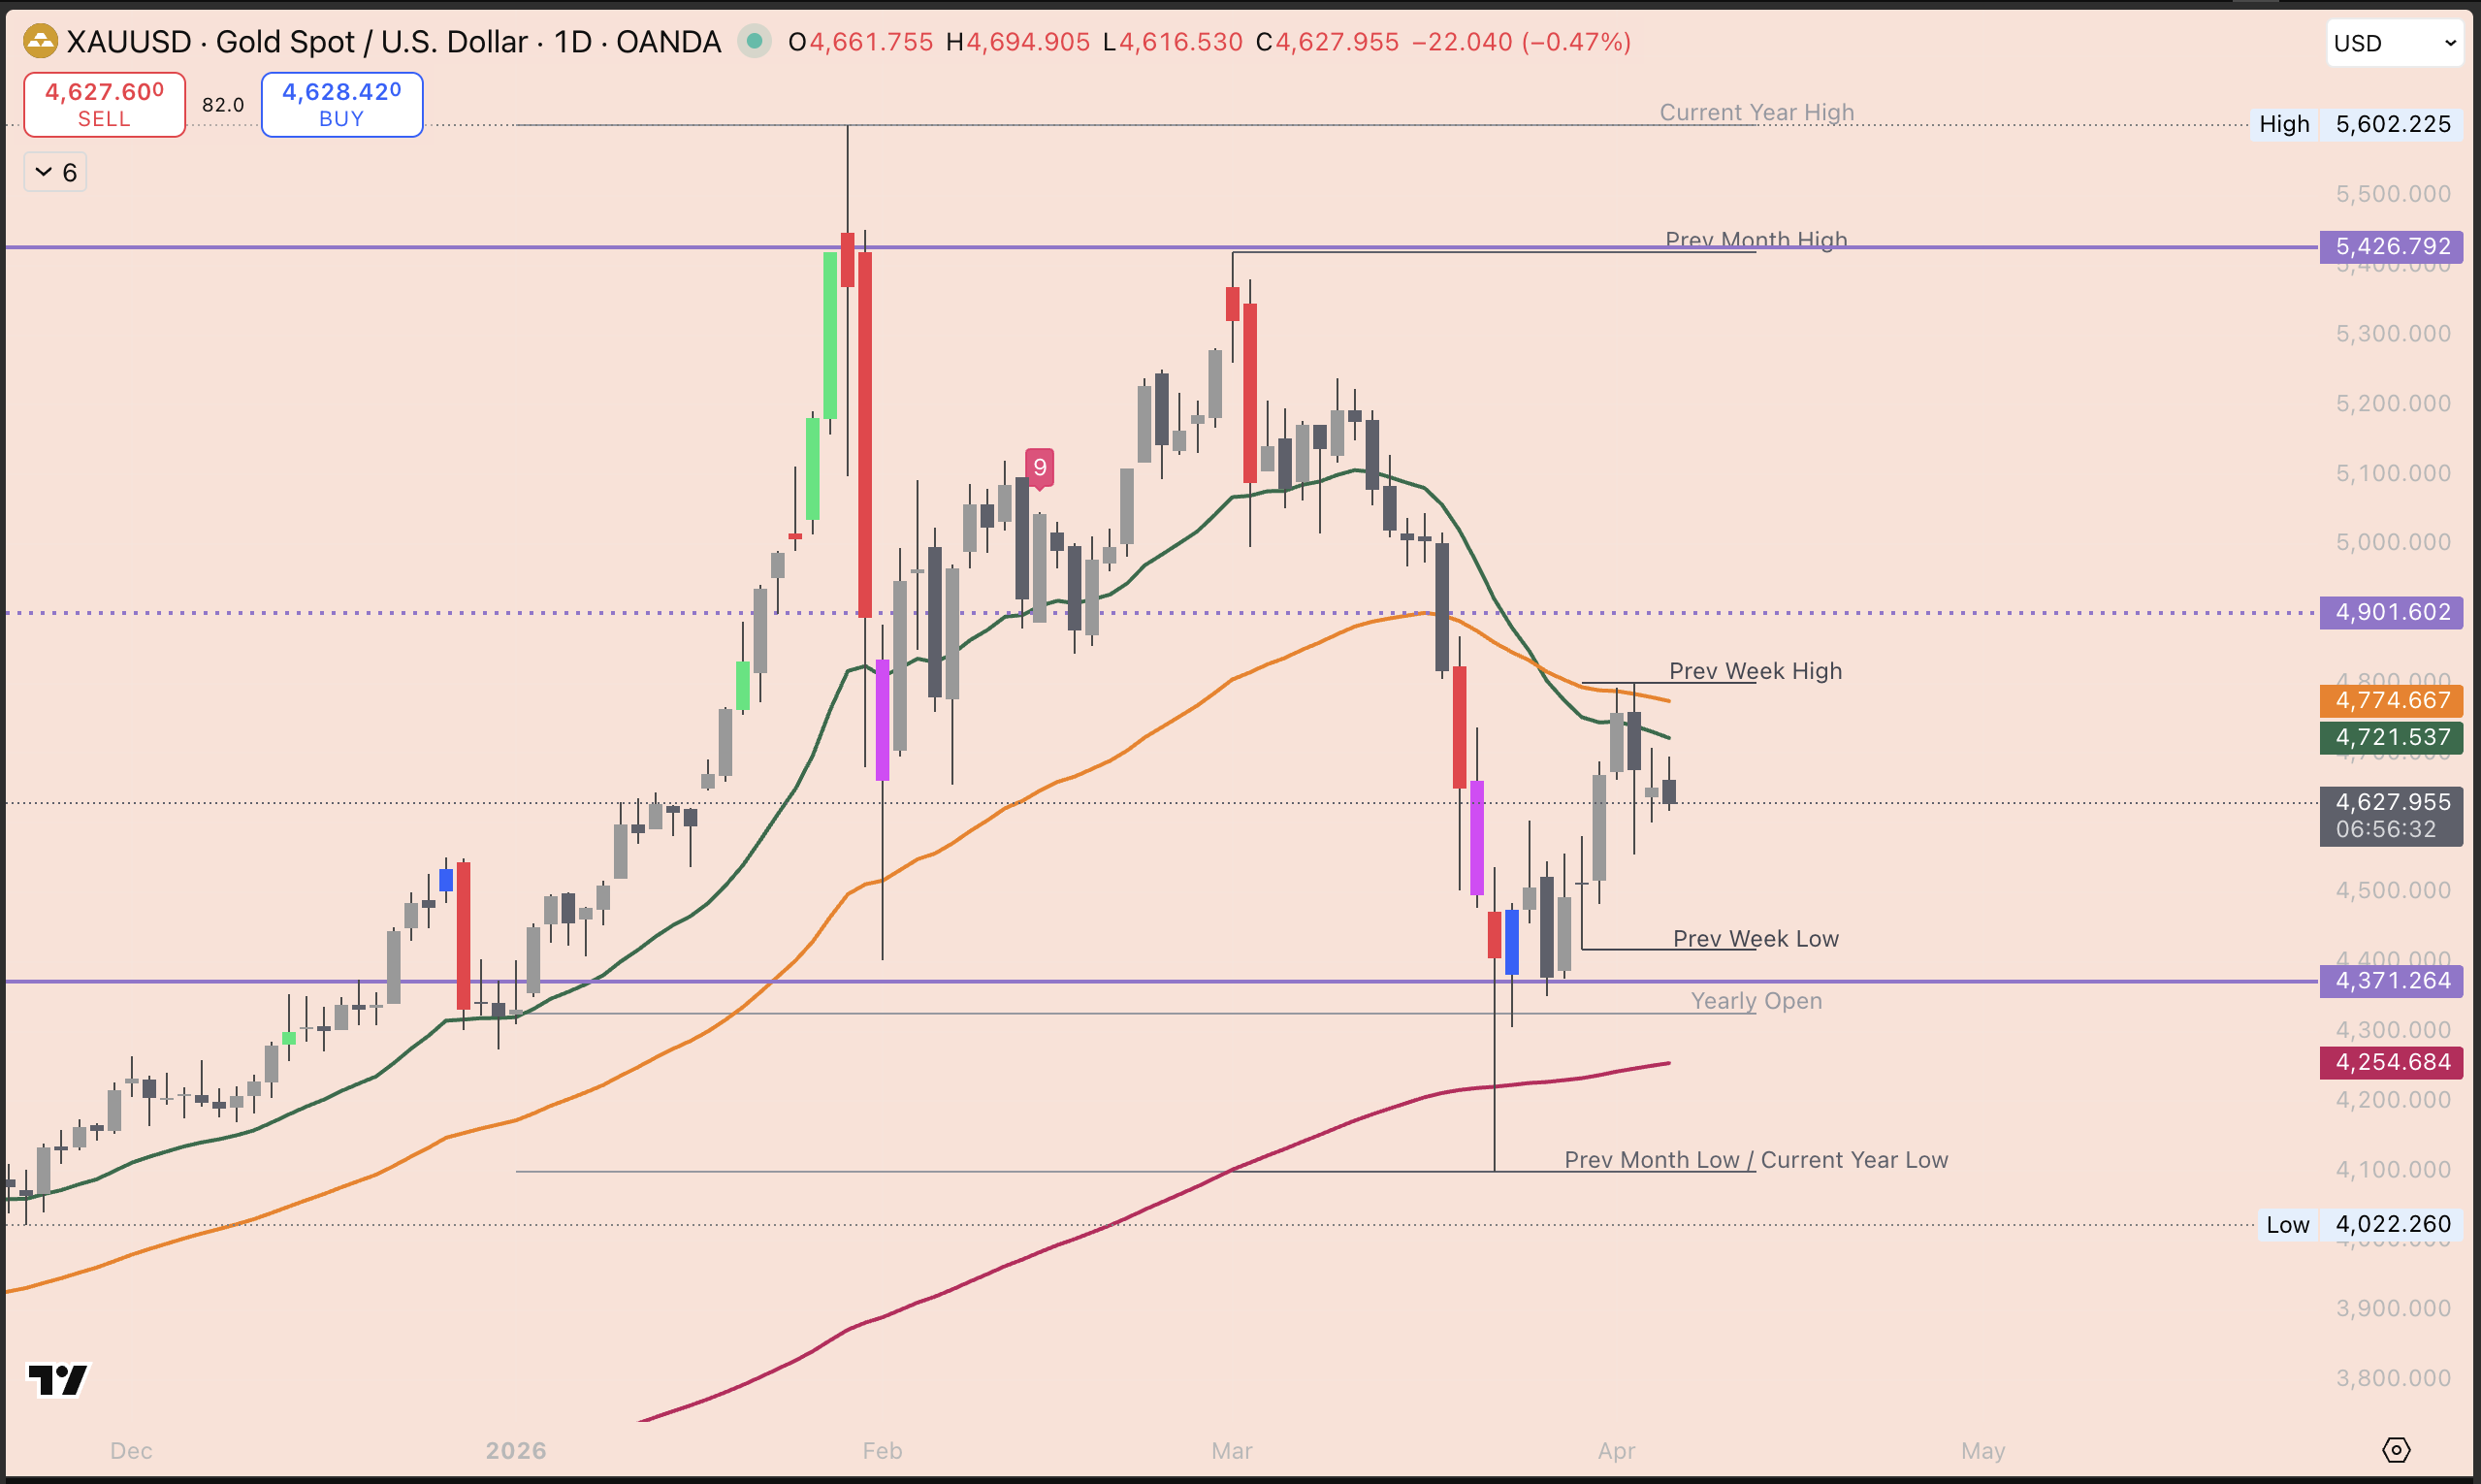
Support is the floor: a price level where buyers have historically stepped in and stopped the price from falling further. On the Gold daily chart, that level is the solid line at $4,371. That's our floor.
Resistance is the ceiling: a price level where sellers have historically stepped in and stopped the price from going higher. On this chart, that level sits up at $5,427. That's our ceiling.
Everything that happens in between those two levels is just price moving around inside the room. Right now, Gold is trading at around $4,658 - which means it's sitting in the lower half of that range, closer to the floor than the ceiling.
You'll also notice a dotted line sitting roughly halfway between the two at $4,901. That's the midpoint of the range. It's worth knowing because price often pauses or reacts around the middle before deciding which direction to go next.
Once you can see the floor, the ceiling, and the midpoint - you already know more than most people looking at this chart. Now switch back to 4H and let's dig deeper.
What the Moving Averages Are Telling You
Remember in Lesson 5 when we said: green above orange, orange above red = trend is up?
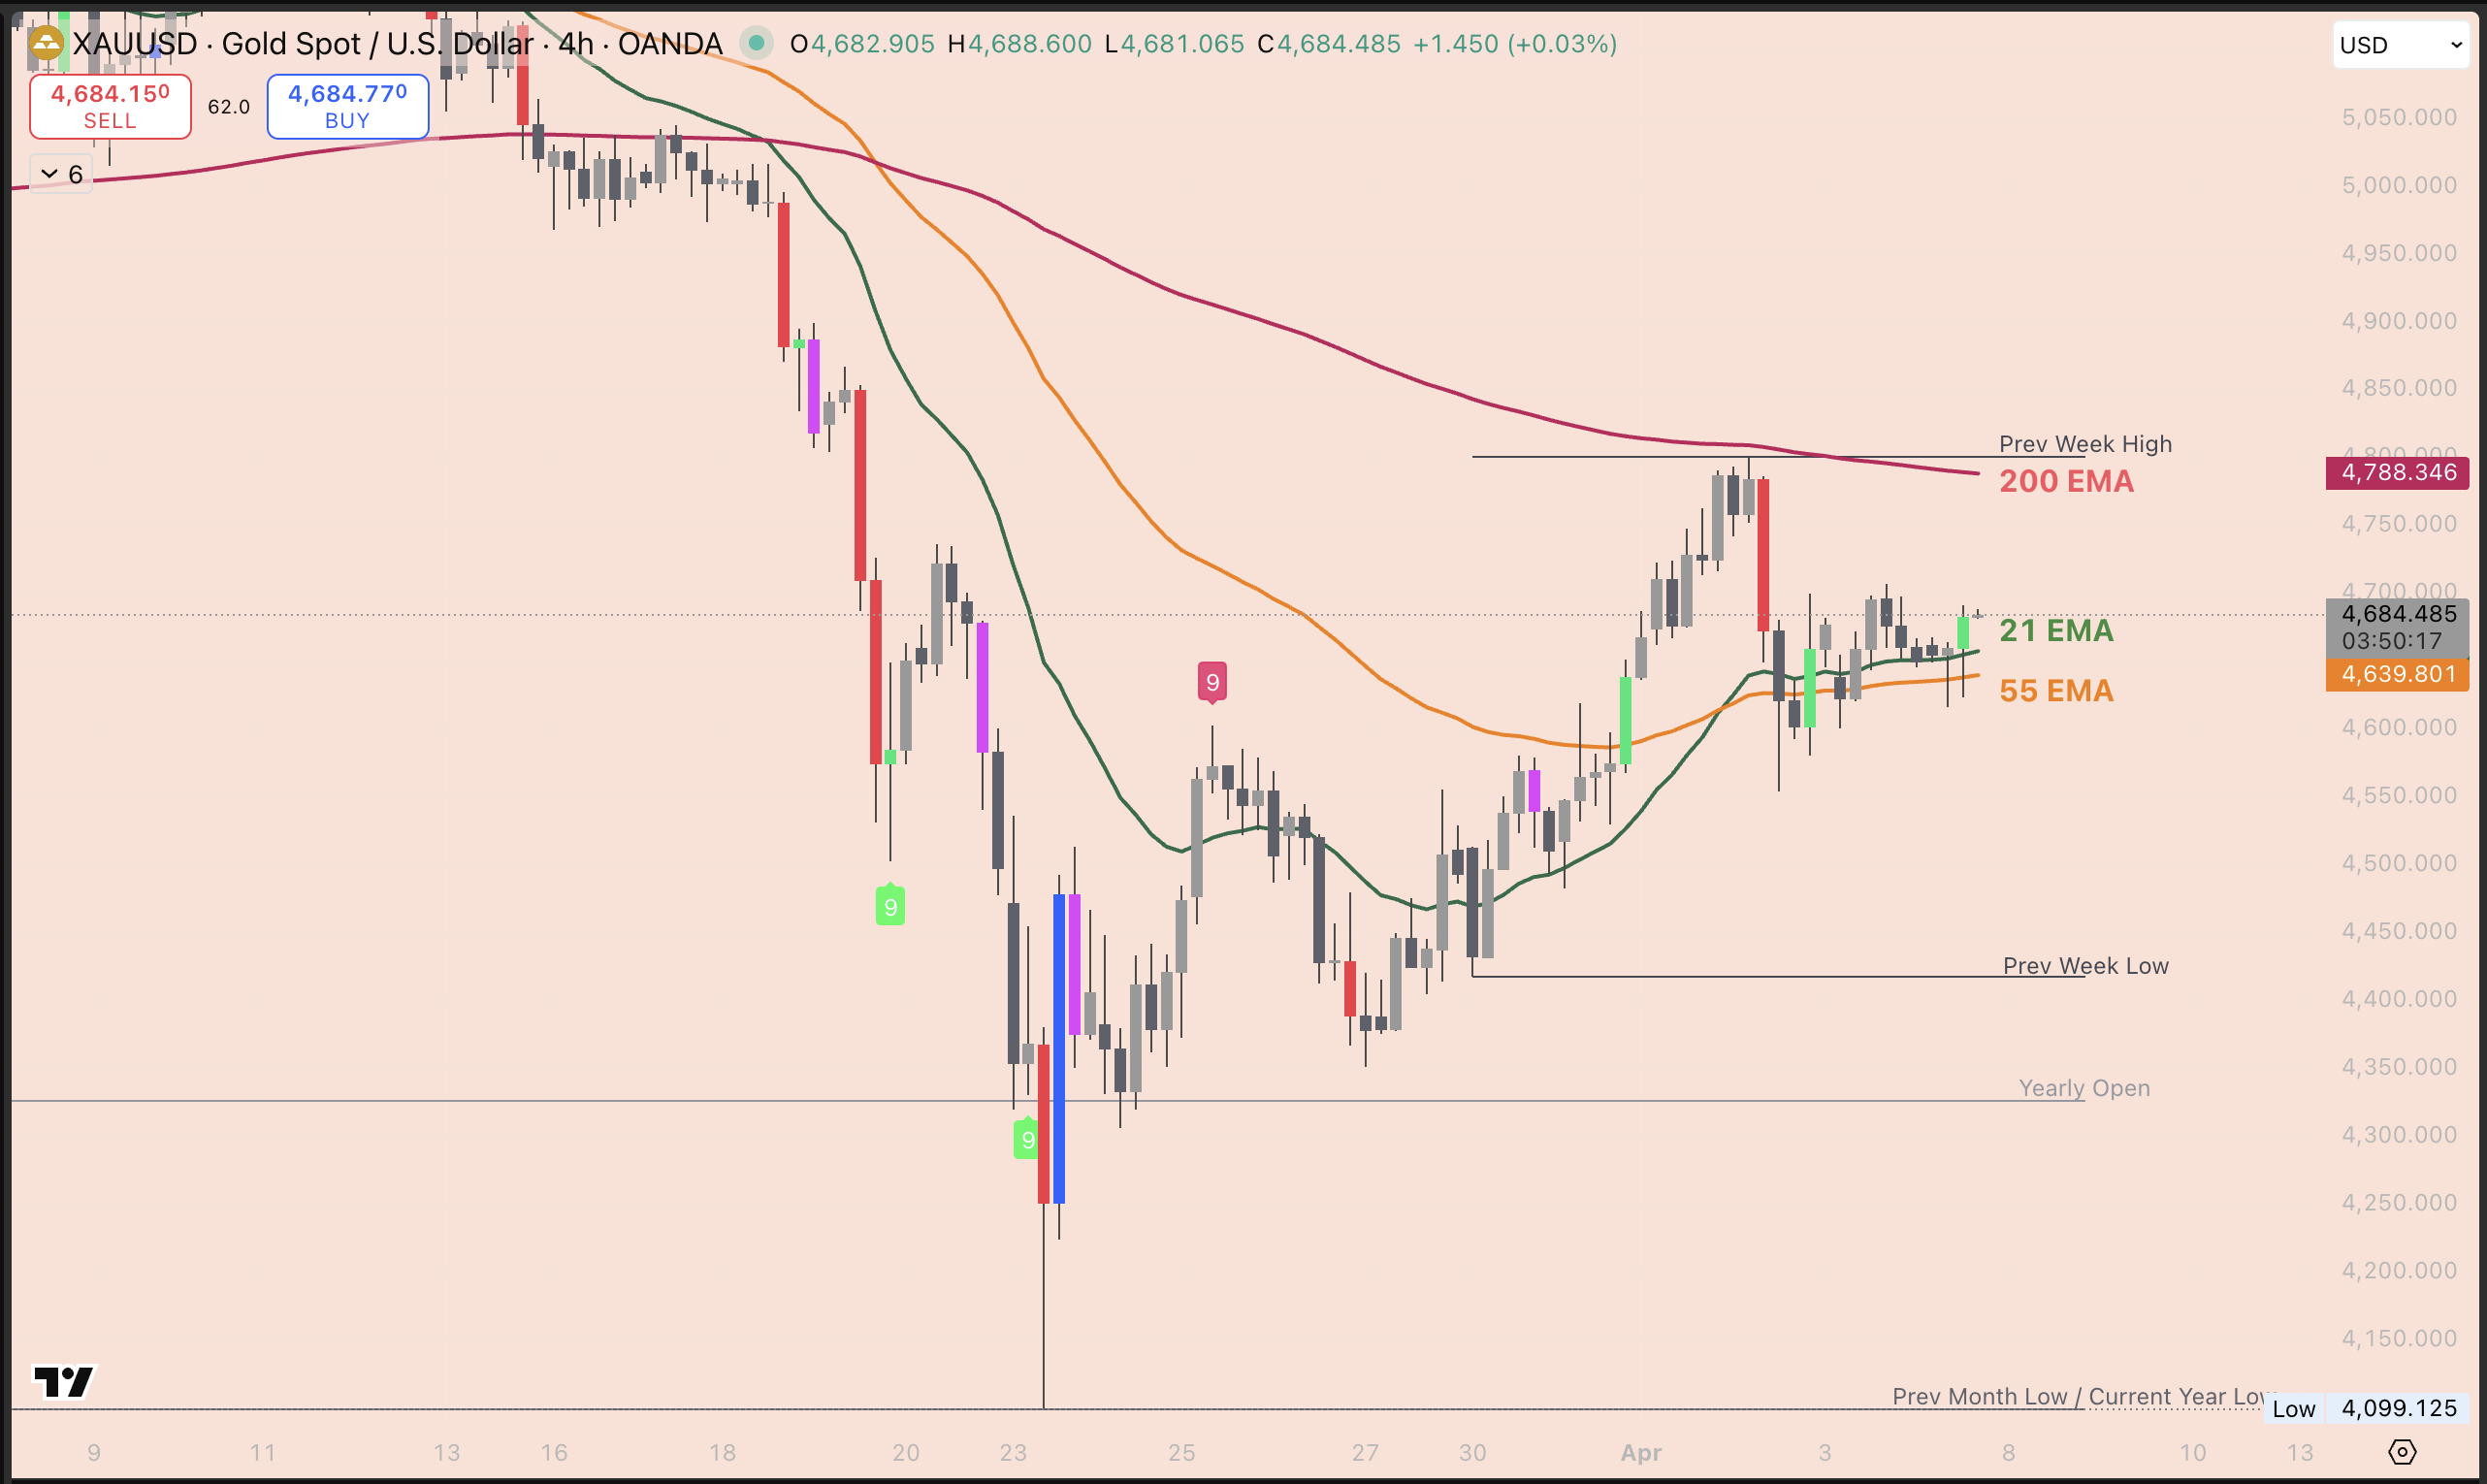
Look at your chart now. That's not what you're seeing.
The red line - the 200 EMA, the one that moves slowest and tells you the big picture - is still curving downward and sitting well above the current price. That tells you the longer-term trend on Gold is still pointing down.
But here's where it gets interesting.
After a massive drop from around $5,400 all the way down to $4,100, Gold has stopped falling. The candles have found a floor. And in the last few days, the green and orange lines have started turning upward. That's the first sign that momentum may be shifting.
The moving averages are showing you a battle in progress. The big trend (red) is still down. But the shorter-term trend (green and orange) is starting to push back up. This is called a recovery, and it's one of the most important things you'll learn to spot on a chart.
What the Fib Is Showing You
Now draw your Fib on this chart. Remember in Lesson 5, we are looking for a clear wave. This time we're drawing from the bottom up, because Gold has already made its low, and we want to understand the bounce.
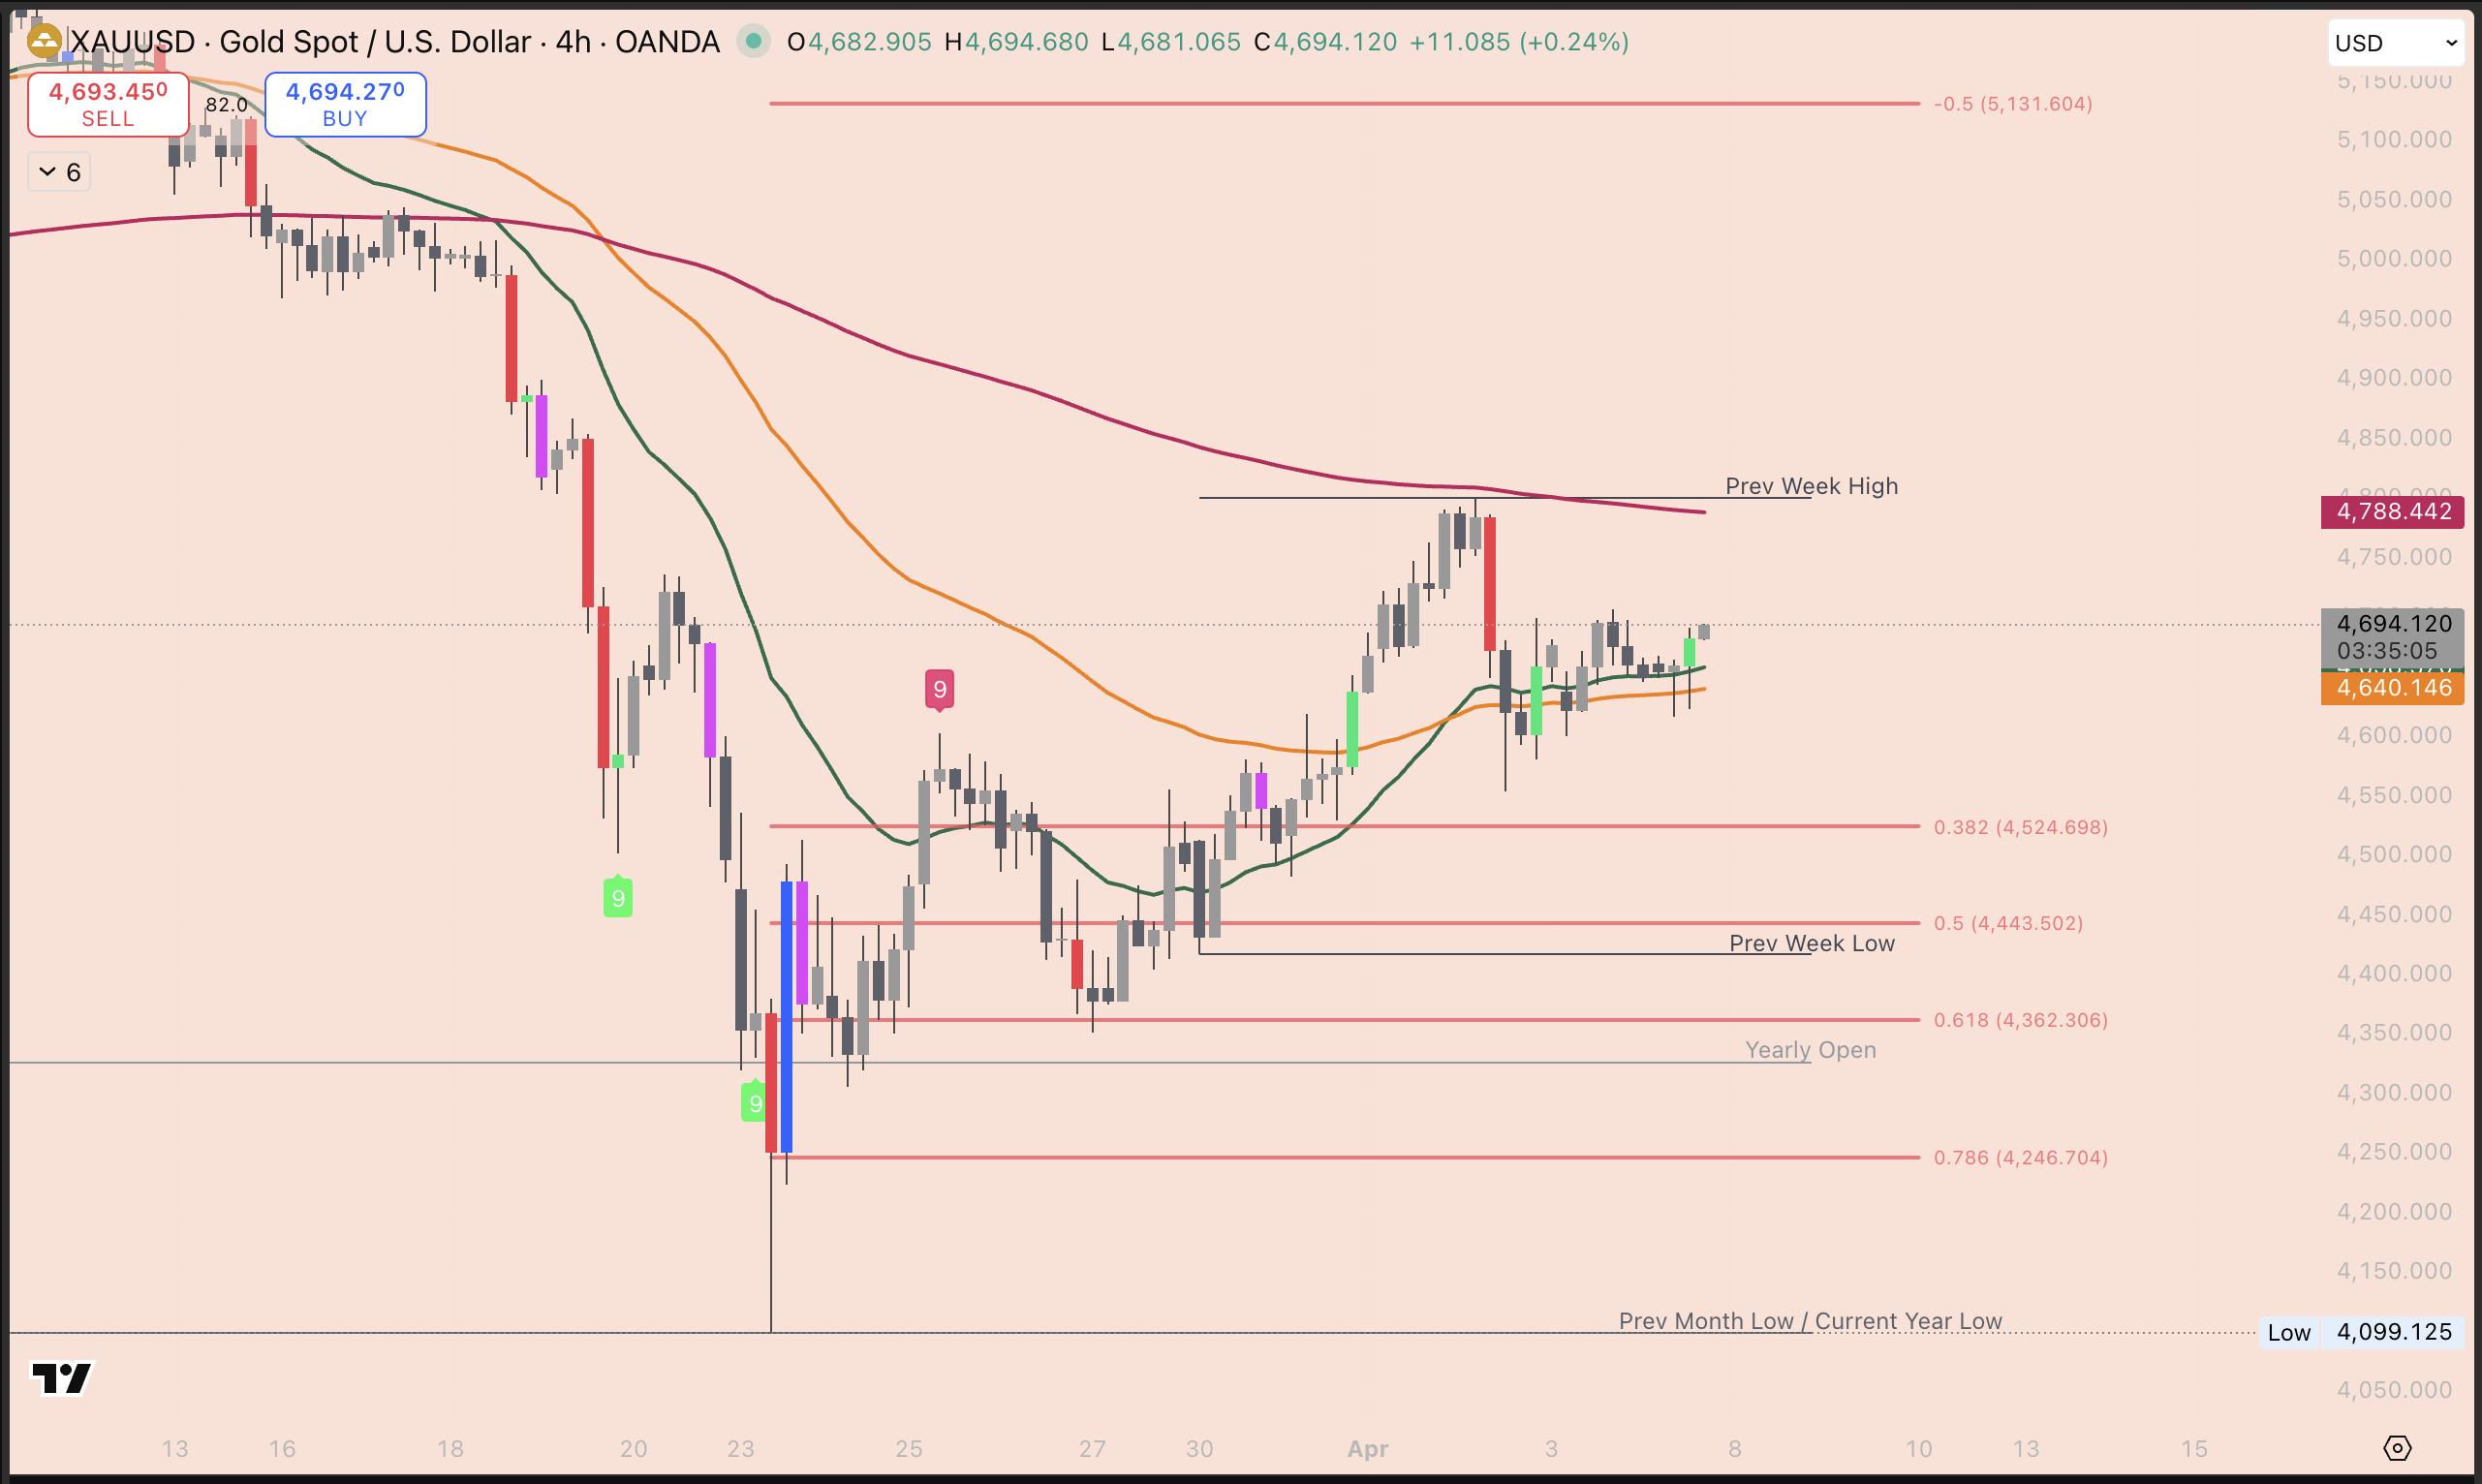
Find the current year low at $4,099 - that's your starting point. Drag up to the most recent high around $4,789. Click the low first, drag to the high, and release.
Your Fib levels will land at:
- $4,523 the 0.382 level: The first zone where price could pull back to after the bounce.
- $4,442 the 0.5 level: The halfway point. A deeper but still healthy pullback. Notice the previous week low sits almost exactly here too, when two separate reasons line up at the same price, that level carries more weight.
- $4,361 the 0.618 level: This is the golden pocket - the zone traders watch most closely. A pullback here and holding would be a strong signal.
- $4,245 the 0.786 level: The deepest meaningful zone. If price gets here, the bounce is being seriously tested.
Current price is sitting around $4,641 - hovering above the 0.382 level. The Fib is now your map. Those levels below are the zones worth watching if price pulls back before its next move up.
The Line That Changes Everything
Now try drawing a trend line on your chart. Go back to Lesson 5, select the trend line tool from the left toolbar, and connect the highs from left to right.
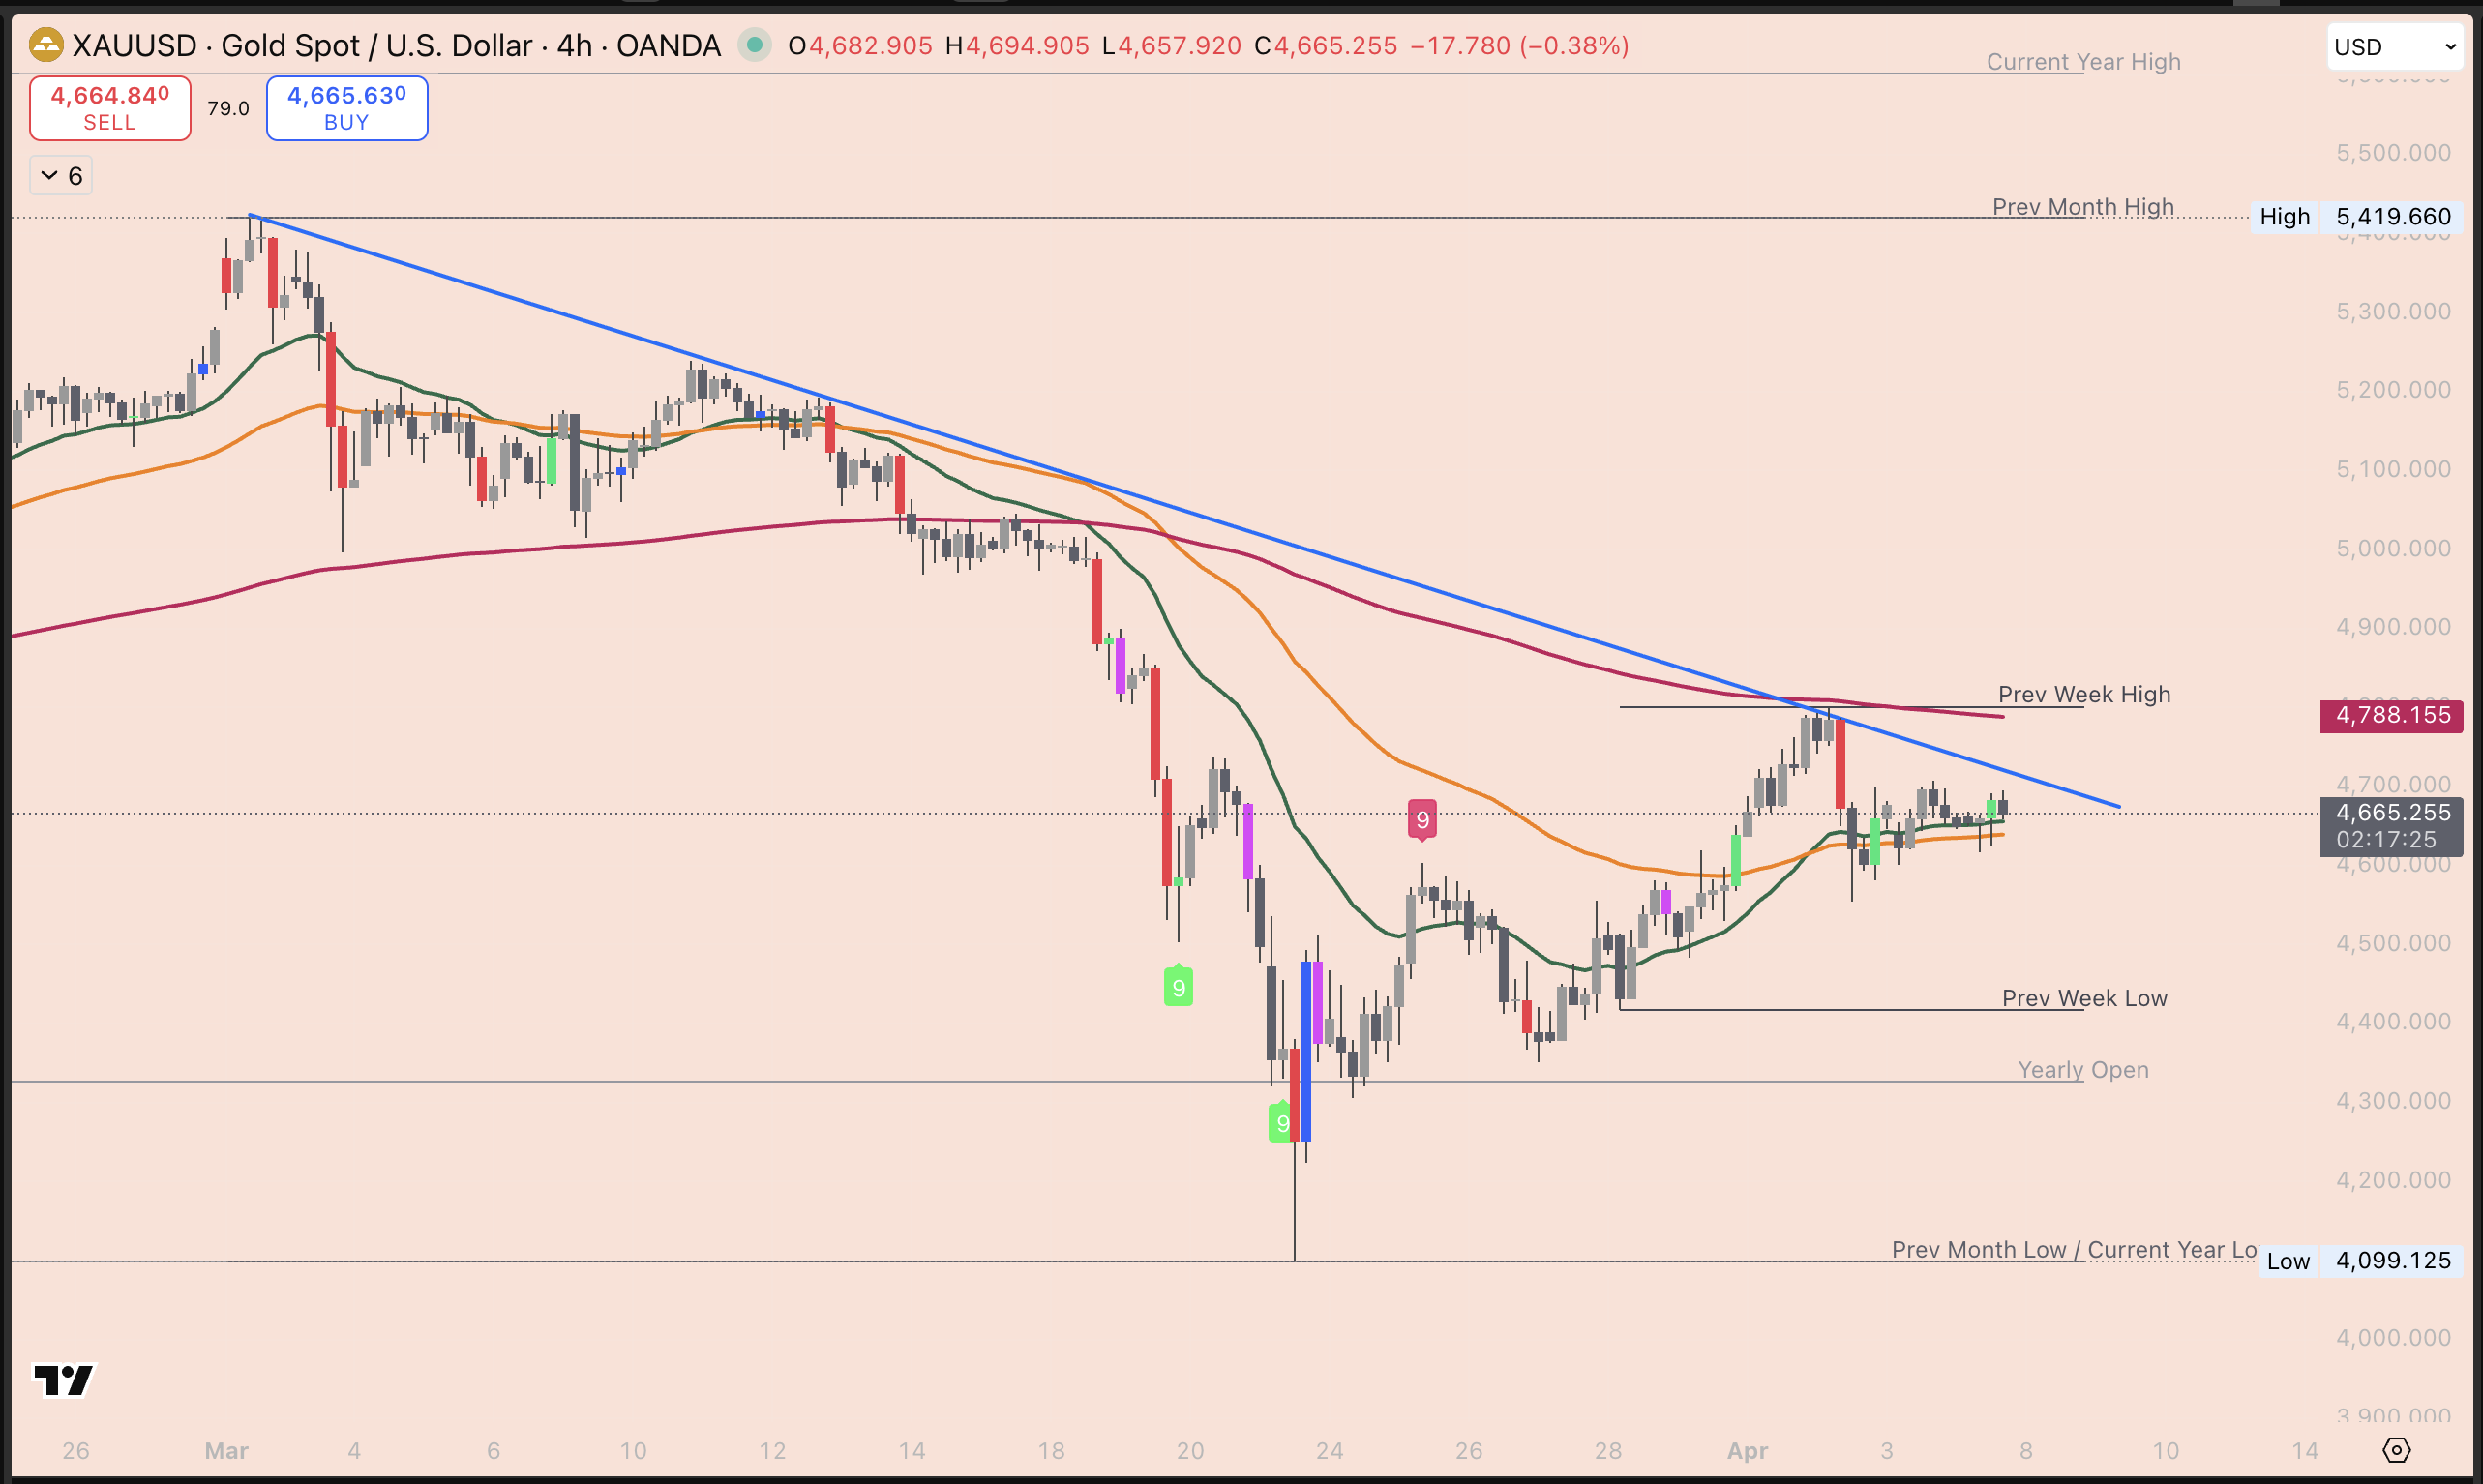
Start from the previous month high around $5,419, then connect it through the series of lower highs as price came down. You'll end up with a diagonal line sloping downward - this is called a descending trendline. It's the market making lower and lower highs over time, which is the definition of a downtrend.
Here's why this matters right now: current price at $4,688 is sitting right below that line.
That line has been acting as a ceiling for weeks - every time price approaches it, sellers push it back down. Until we see strong green candles closing clearly above it, the downtrend is still in control.
That's the thing to watch above everything else this week.
Your First Trade Idea - How to Think About It
This isn't an instruction to trade. It's your first time walking through how a trade idea actually forms - using the tools you just learned.
Here's how we'd think about Gold right now:
The big red line (200 EMA) is still pointing down and sitting well above price. That means the longer-term trend is still against us for a long trade. We don't fight that.
But the green and orange lines are turning upward, and price has bounced strongly off the year low. So we watch and wait. What we'd want to see is price pull back into one of those Fib zones - the $4,442–$4,523 area or deeper toward the $4,361 level - hold there, and then show signs of pushing back up. That's when the moving averages and the Fib are working together, and the picture starts to get clearer.
If price breaks back below $4,245, the recovery is in serious trouble. If price holds the Fib zones and the green line stays above orange, the bounce has legs.
Two scenarios. Two outcomes. That's how every trade idea starts.
Mom Tip: Open Gold on your TradingView right now, draw that Fib wave from $4,099 up to $4,789, and find those four levels on your chart. Then just watch what the candles do around them over the next few days. You're not placing a trade, you're learning to read the map. That's the whole game right now.
The content in this post is for educational purposes only and reflects our personal perspectives on the market. It is not financial advice. Always do your own research before making any trading decisions. We are sharing our ideas — not telling you what to do with your money.
27/02/2026
Gold has been the "ultimate safe haven" lately, but even the king of metals needs a breather. Let’s break down this chart with the latest global vibes and some fresh numbers.
The Big Picture (Current Price Action)
Gold is currently in a "corrective rebound" phase. After a massive waterfall drop from all-time highs earlier this month, the price is trying to crawl back up.
Right now, gold is trading around $5,177 – $5,180. It’s a bit of a "wait-and-see" Friday as traders digest a lot of mixed signals from the U.S. and overseas.
Key Levels (The Floors and Ceilings)
On your 4-hour chart, you'll see the price is wedged between some very clear boundaries:
- Critical Support (The Floor): $5,046. This is our "must-hold" level. As long as the price stays above this, the recovery is still on the table. If we break below it, we might see a slide toward $4,960.
- Major Resistance (The Ceiling): $5,200 – $5,250. This is the immediate "stop sign" where the sellers are hanging out. Gold actually hit $5,250 earlier this week, but got pushed back down.
- The Big Dream Target: If we can blast through $5,250, the next stop for the "gold train" is up near $5,307 – $5,448.
Technical & Global Vibe Check
- The "Trump Trade": President Trump’s recent State of the Union address initially sent gold surging because of uncertainty over new 15% global tariffs. However, today the price is cooling off because the market is starting to "price in" these changes.
- Middle East Tensions: There are ongoing nuclear talks between the U.S. and Iran in Geneva. If these talks go well, gold might drop (less fear). If they stall, gold could head toward $5,500.
- The Dollar Factor: The U.S. Dollar Index (DXY) is creeping up slightly to 97.78, which acts like a "weight" on gold prices.
RSI: The Speedometer (Relative Strength Index)
The RSI is a little line that lives at the bottom of your chart. It tells you how fast a stock is running and if it’s starting to get "tired." It moves between 0 and 100.
Current Vibe: Right now, Bitcoin's weekly RSI is at a historic low of 25.6—it's never been this "exhausted" before! For Tesla, the RSI is hovering around 45, which is like driving the speed limit—not too fast, not too slow.
Volatility: The Weather Report
Volatility is simply how much a price "swings" up and down.
Current Vibe: Volatility is very high right now! Between the $7.8 billion in Bitcoin options expiring today and the news coming out of the US about EV policies and global tariffs, the "market weather" is definitely stormy.
When we see High Volatility combined with an Oversold RSI, that is often our "Gold Mine" signal.
- High Volatility creates a big, fast drop.
- Oversold RSI (under 30) tells us the drop is likely overextended.
- The Result: We wait for that "Higher-Low" we talked about earlier to confirm the bounce, and then we enter with a plan!
💡 Mom Tip: In a stormy market (high volatility), RSI can stay "Oversold" longer than you think. Just because the speedometer says we're going slow doesn't mean we can't go even slower.
Always wait for the price to actually start moving back up before jumping in! Friday afternoons can be "profit-taking" time. If you don't see a clear bounce by 11:00 AM EST, it might be safer to keep your hands in your pockets and wait for the Sunday night market open!