Uranium: Trade Notes + Beginner's Guide

25/06/2026
Every so often, I like to put something new in front of you. Not because we're going to trade it tomorrow, but because the more pieces of the puzzle you can read, the more the whole market starts to make sense. And I'm especially drawn to assets that tie into the big picture, the things quietly powering the world, like tech and oil. Once you can read those, you can read almost anything.
Today's new one is uranium. And it's having a moment. Not the quiet, boring, "fuel that powers reactors" kind of moment. The "every headline mentions AI and nuclear in the same breath" kind. So when something is this loud, I want to slow down and actually read the chart, because loud is usually when people get hurt.
And right now the chart is telling me one thing very clearly: not yet.
First, What Are We Actually Looking At?
This matters, so stay with me for a second.
When you search "uranium" on TradingView and pull up this FXCM chart, you are NOT looking at the price of uranium itself, the physical metal that gets dug out of the ground. You're looking at a basket of uranium mining companies bundled into one chart. The four names on it are worth knowing, because each one does a different job in the uranium world:
Cameco (CCJ) - the giant. One of the biggest uranium producers on the planet. They own the mines, dig the stuff out, and sell it to the power companies that run nuclear reactors. They also part-own Westinghouse, which actually builds reactors. If you want one company that touches the whole chain, it's this one.
Denison (DNN) - a smaller, earlier-stage player. They're developing mines in Canada that aren't fully in production yet. Smaller companies like this move faster and harder in both directions, more reward if it works out, more risk if it doesn't.
NexGen (NXE) - sitting on one of the largest undeveloped uranium deposits in the world, also in Canada. Think of them as holding a treasure chest they haven't fully opened yet. The whole bet is on what's coming, not what they're producing today.
URNM - this one isn't a company at all. It's an ETF. ETF stands for Exchange-Traded Fund. Picture a basket that holds lots of different companies all at once. Instead of buying Cameco or Denison or NexGen separately, you buy one thing (the basket) and you own a slice of all of them together. URNM is a uranium basket: it holds the big miners in one neat package. The advantage is you're not betting on a single company getting it right. If one stumbles but the sector rises, you're still along for the ride. It's the "don't put all your eggs in one basket" idea, turned into something you can actually buy.
So this FXCM chart is a basket of baskets, a few individual miners plus a whole ETF, blended into one line. That's important because it behaves differently from any single one of them.
Think of it like the difference between the price of coffee beans and the share price of your favourite café chain. The same thing? No. The café can soar while bean prices sit still because people are betting on the café's future, not today's bean price.
That's exactly what's happening here. The miners have run hard this year on the AI-and-nuclear story, while the actual physical uranium price has lagged behind. The market is betting on the future, not the present. Keep that in your back pocket; it explains a lot about why this chart moves the way it does.
Why Is Uranium Moving?
Here's the story in plain language.
AI needs power. Not a little, an absurd amount. Every time you ask a chatbot a question or a company trains a new model, it's running on data centers that gulp electricity 24 hours a day. Wind and solar can't keep those running when the wind drops or the sun sets. You know what can? Nuclear.
So the biggest tech companies in the world have started doing something nobody expected a few years ago: signing deals to build nuclear power, directly to feed their AI. And you can't run a reactor without uranium.
At the same time, there isn't enough uranium being mined to meet what's coming. Years of nobody investing in it left the cupboard half empty. More demand, not enough supply, you already know what that does to a price. Spot uranium briefly punched above $100 a pound earlier this year for the first time in two years before settling back into the high $80s.
This is the kind of fundamental backdrop that makes a chart worth knowing. But (and this is the whole lesson today), a great story and a great entry are two completely different things.
Start Here: The Weekly Chart
In TradingView, search URANIUM and select the FXCM basket. Set the timeframe to 1W (weekly).
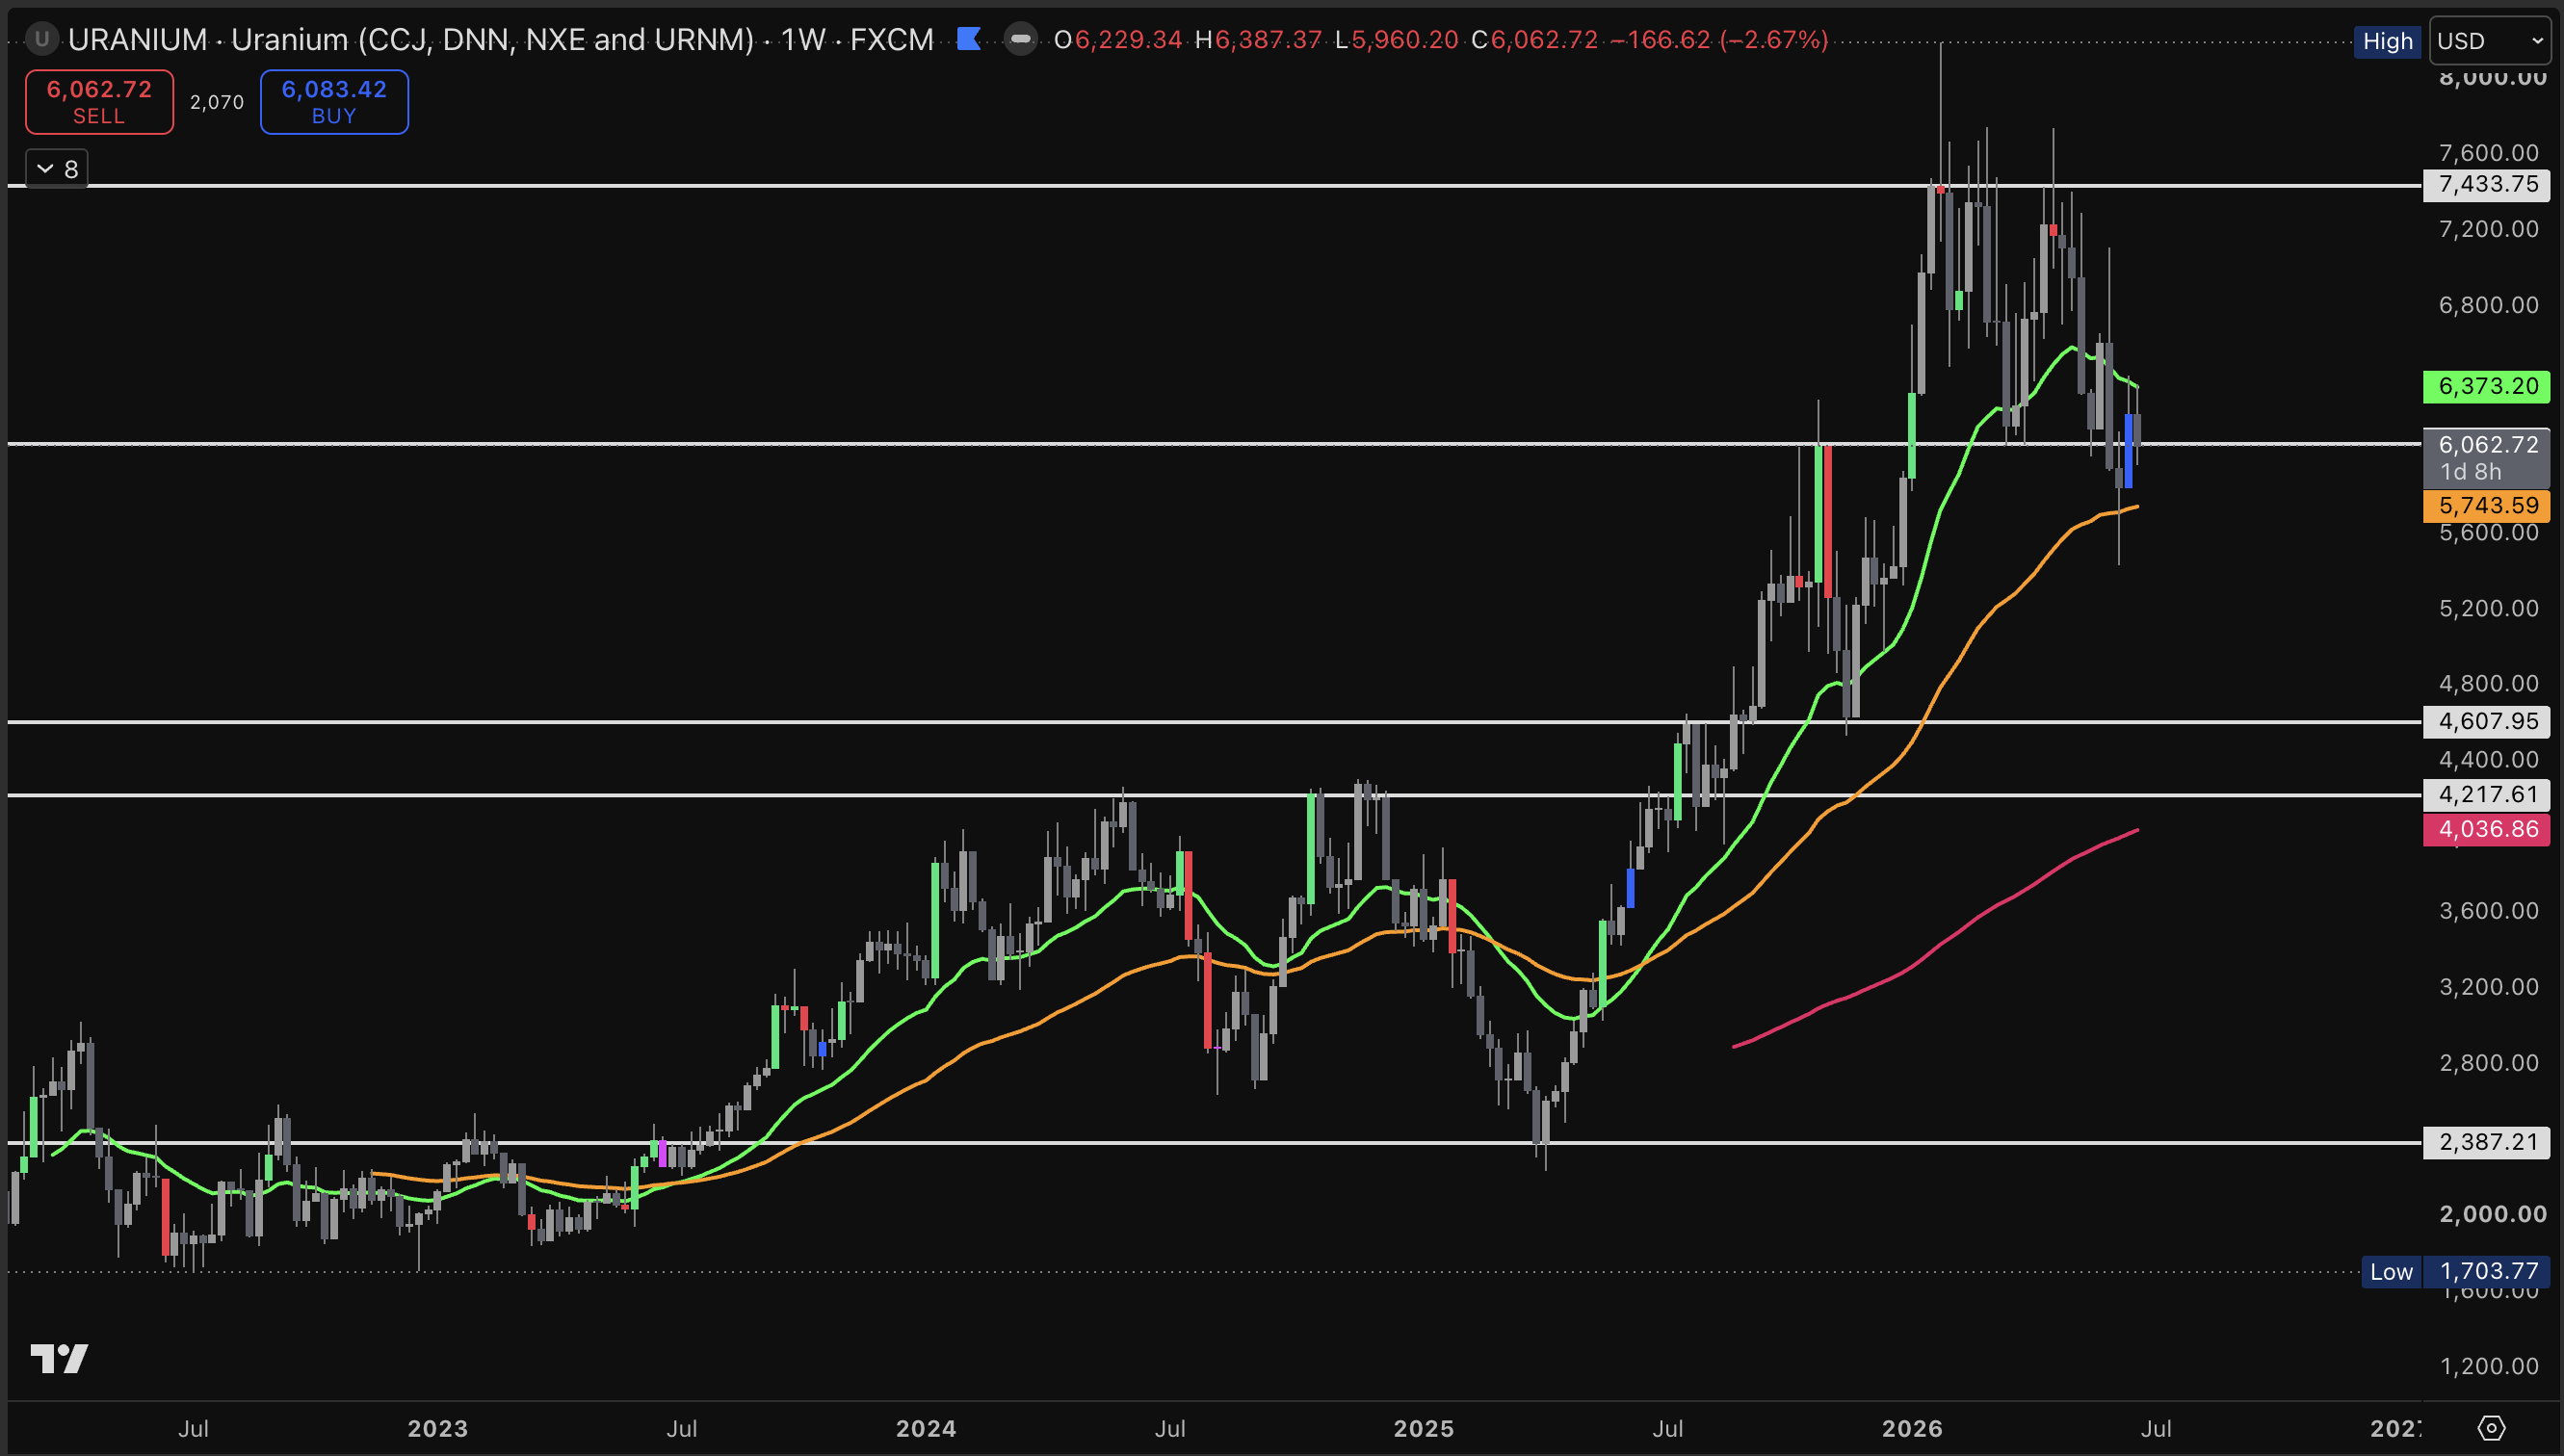
Zoom out and read the story left to right. From 2023, this thing climbed beautifully, from around $1,700 all the way up to a high near 8,100 in early 2026. A clean, multi-year uptrend. Higher highs, higher lows, the whole staircase.
Then, in February, it topped out. And since then? The candles have been making lower highs and lower lows. That's a correction inside a bigger uptrend. The long-term story is still intact, but the medium-term direction right now is down.
Look at your momentum indicator at the very bottom of the weekly. It rolled over from the top and is still pointing down. The big picture trend is up, but the current chapter is a pullback, and that pullback isn't finished telling its story.
The Daily Chart:
Switch to the 1D (daily).
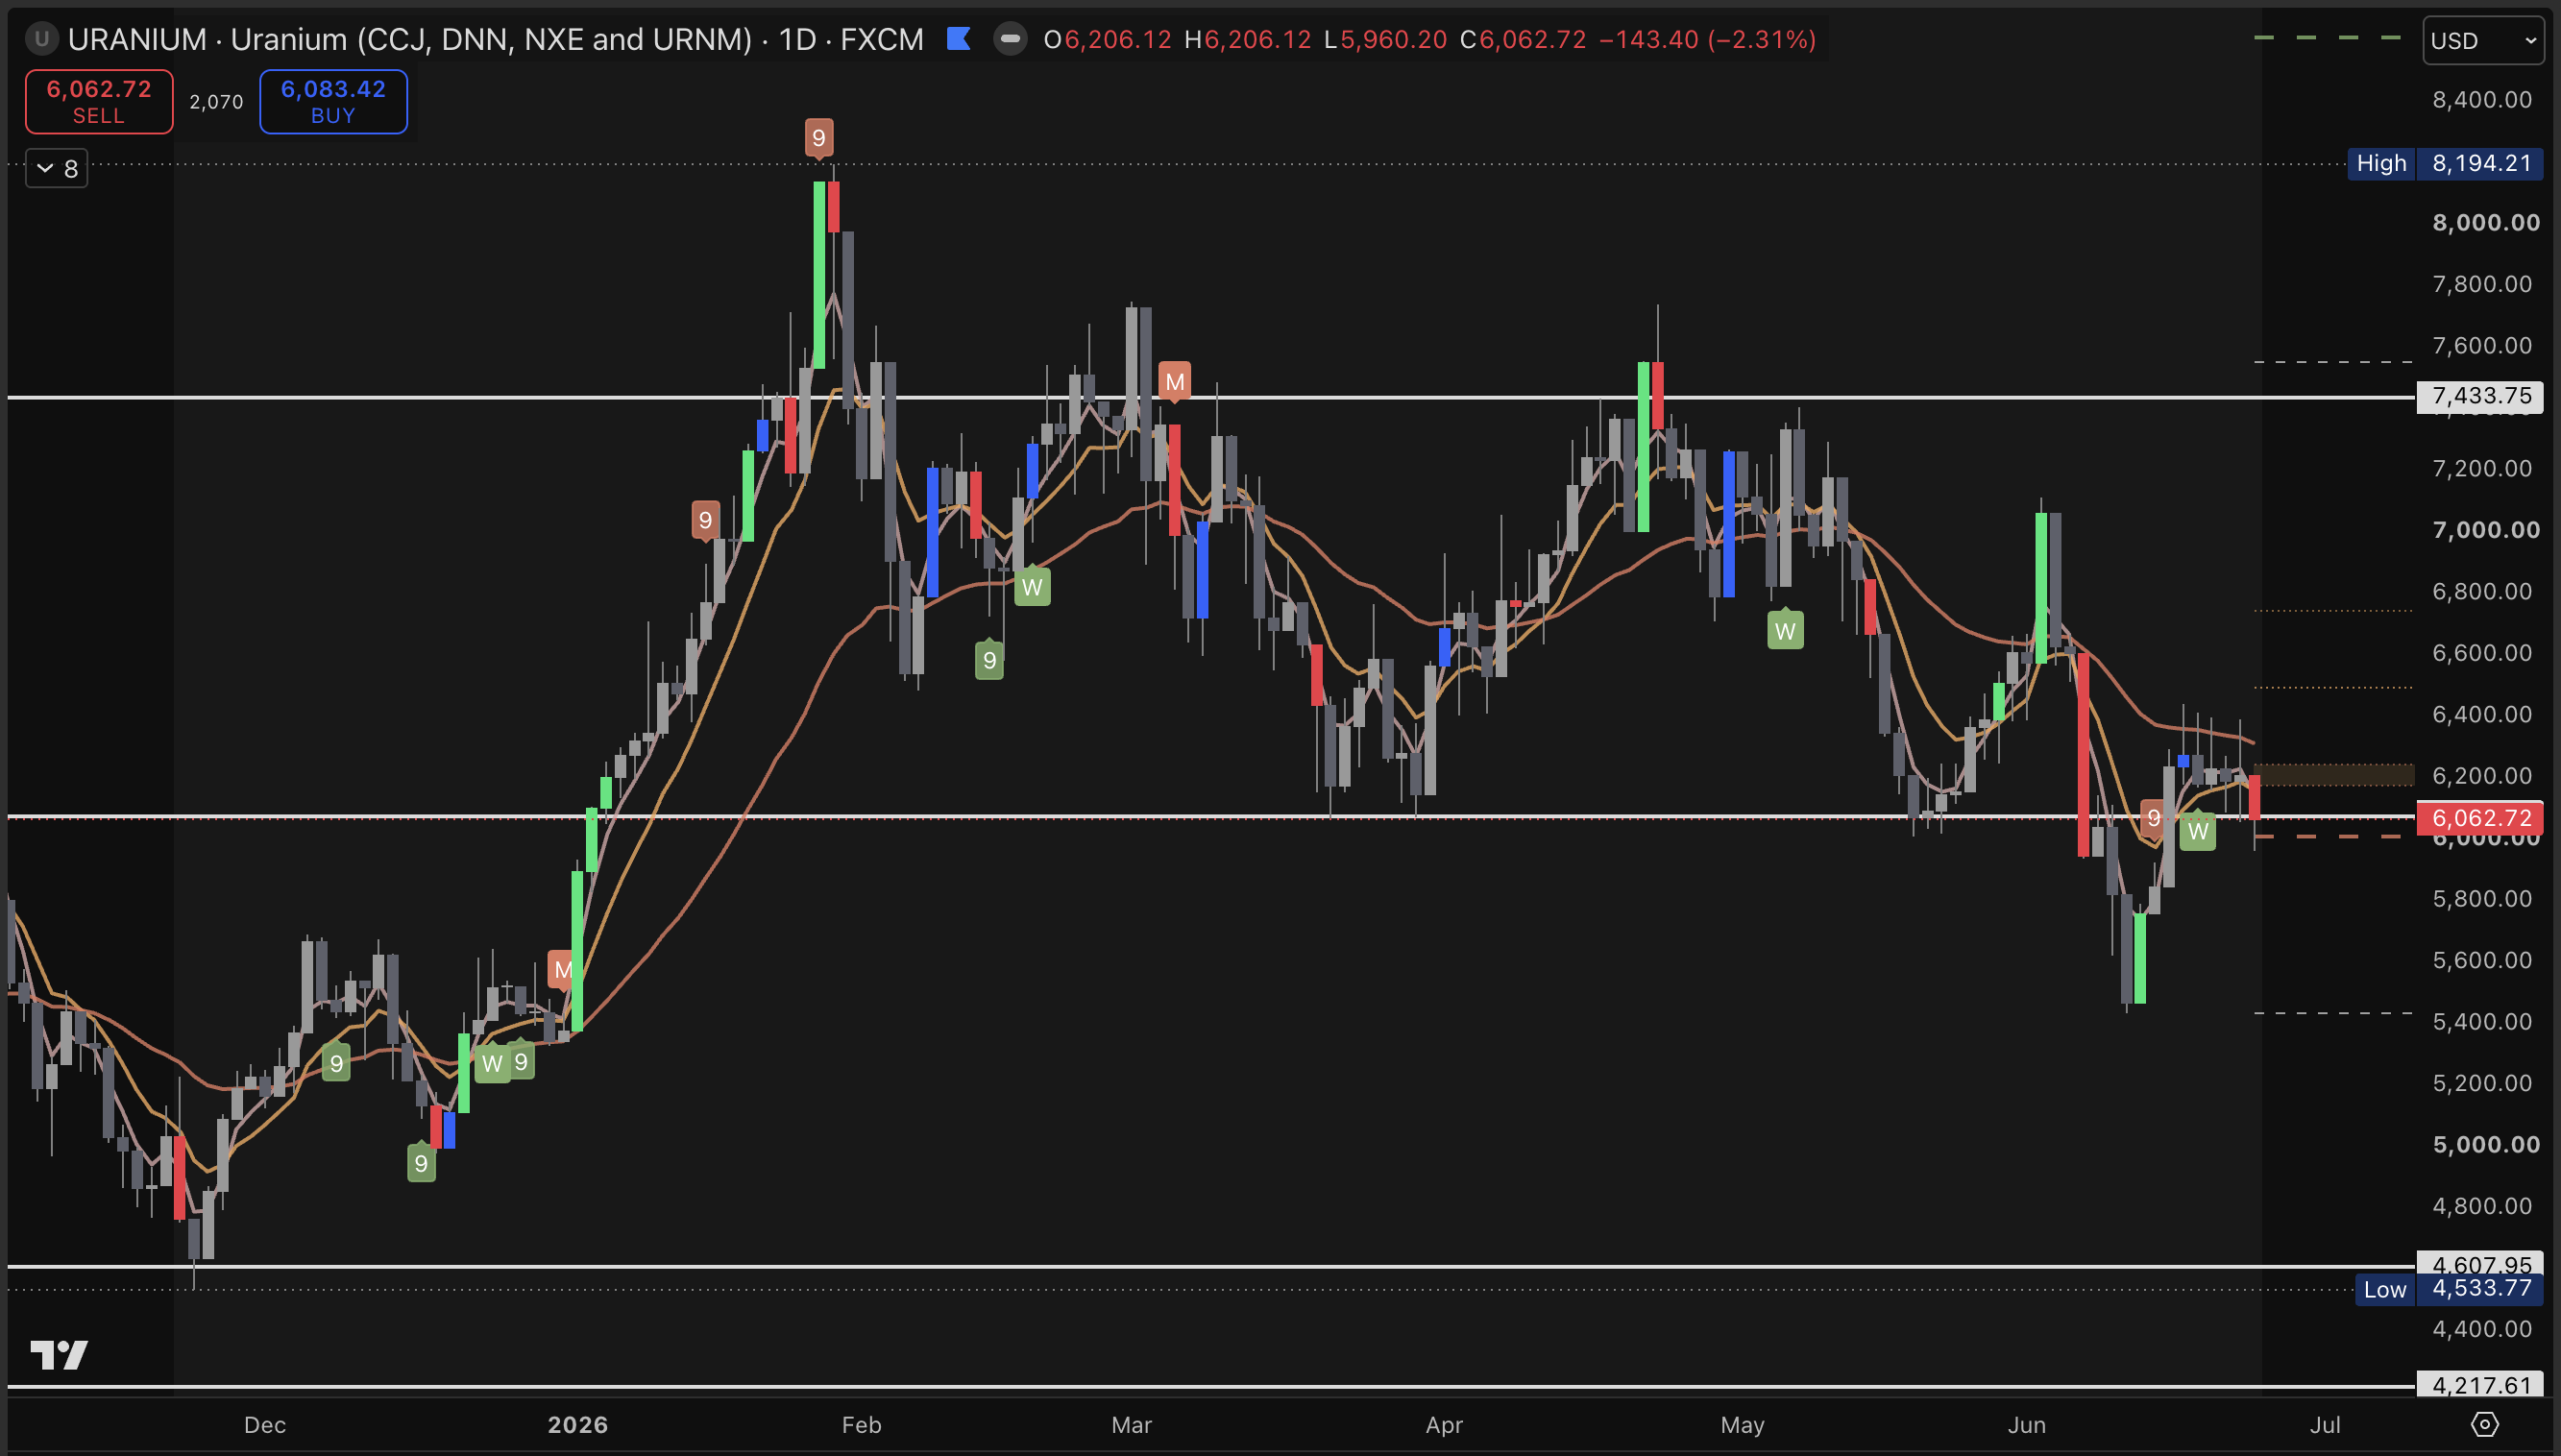
Here's where it gets clear. Since the February top, price has been moving inside a descending channel, picture a hallway tilted downhill. Price bounces off the top of the hallway, slides to the bottom, bounces again, slides again. The whole hallway is pointing down.
A few days ago, price did something important. It dropped all the way to the bottom of that hallway and wicked down to around 5,433, and then snapped back up hard, bouncing all the way to the 6,200 area before easing back to where we sit now, around 6,062.
That sharp wick down and snap back has a name: a liquidity sweep. The market dipped just low enough to scare out the nervous sellers and trigger their stops, grabbed that liquidity, then reversed. That was the moment the smart money stepped in, down at 5,433, three days ago.
Notice where that was. Right at the Yearly Open level (the dashed line around 5,450). When a sweep happens at a level that already matters, it carries more weight. That was a genuinely beautiful spot to be a buyer.
The thing is, that bus has already left the station.
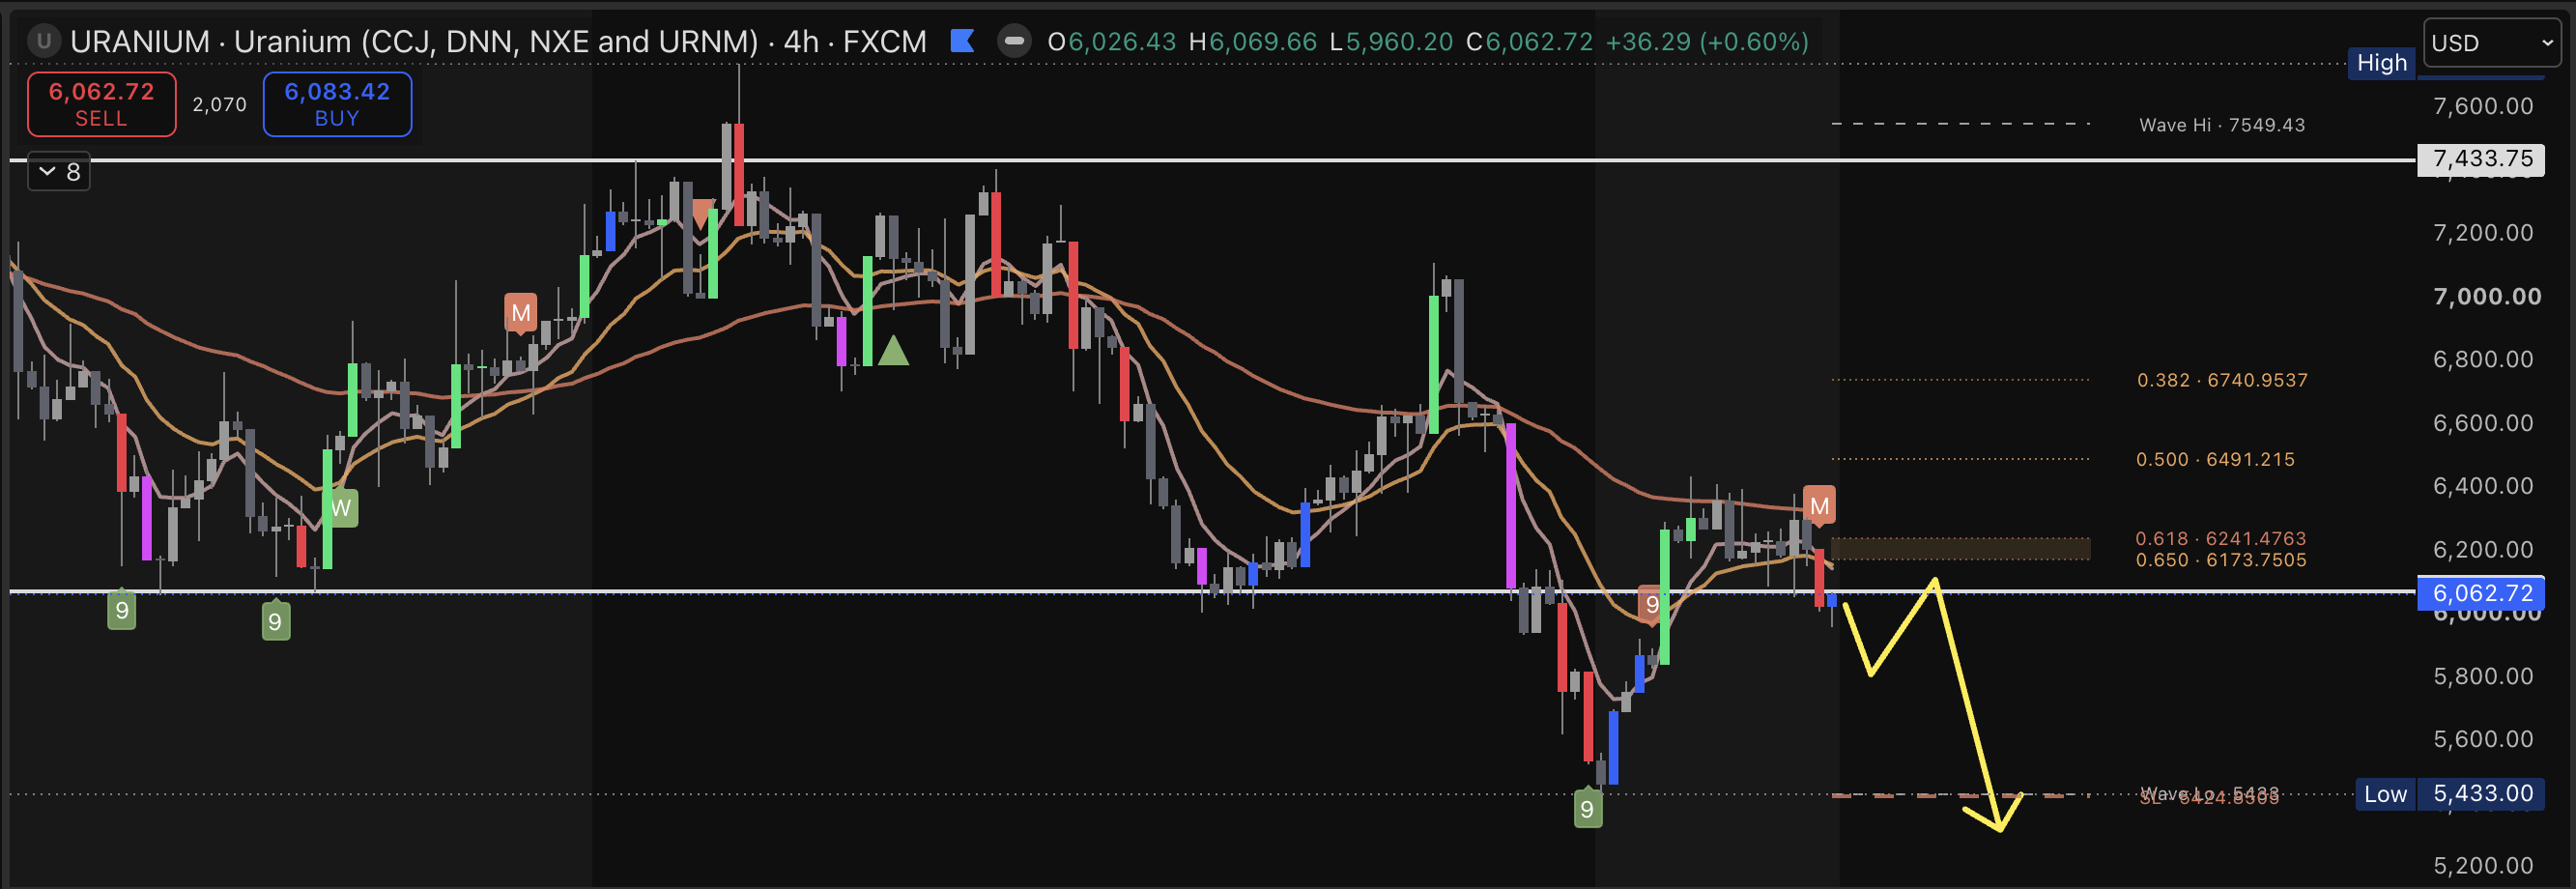
Now the 4H, where we look for entries.
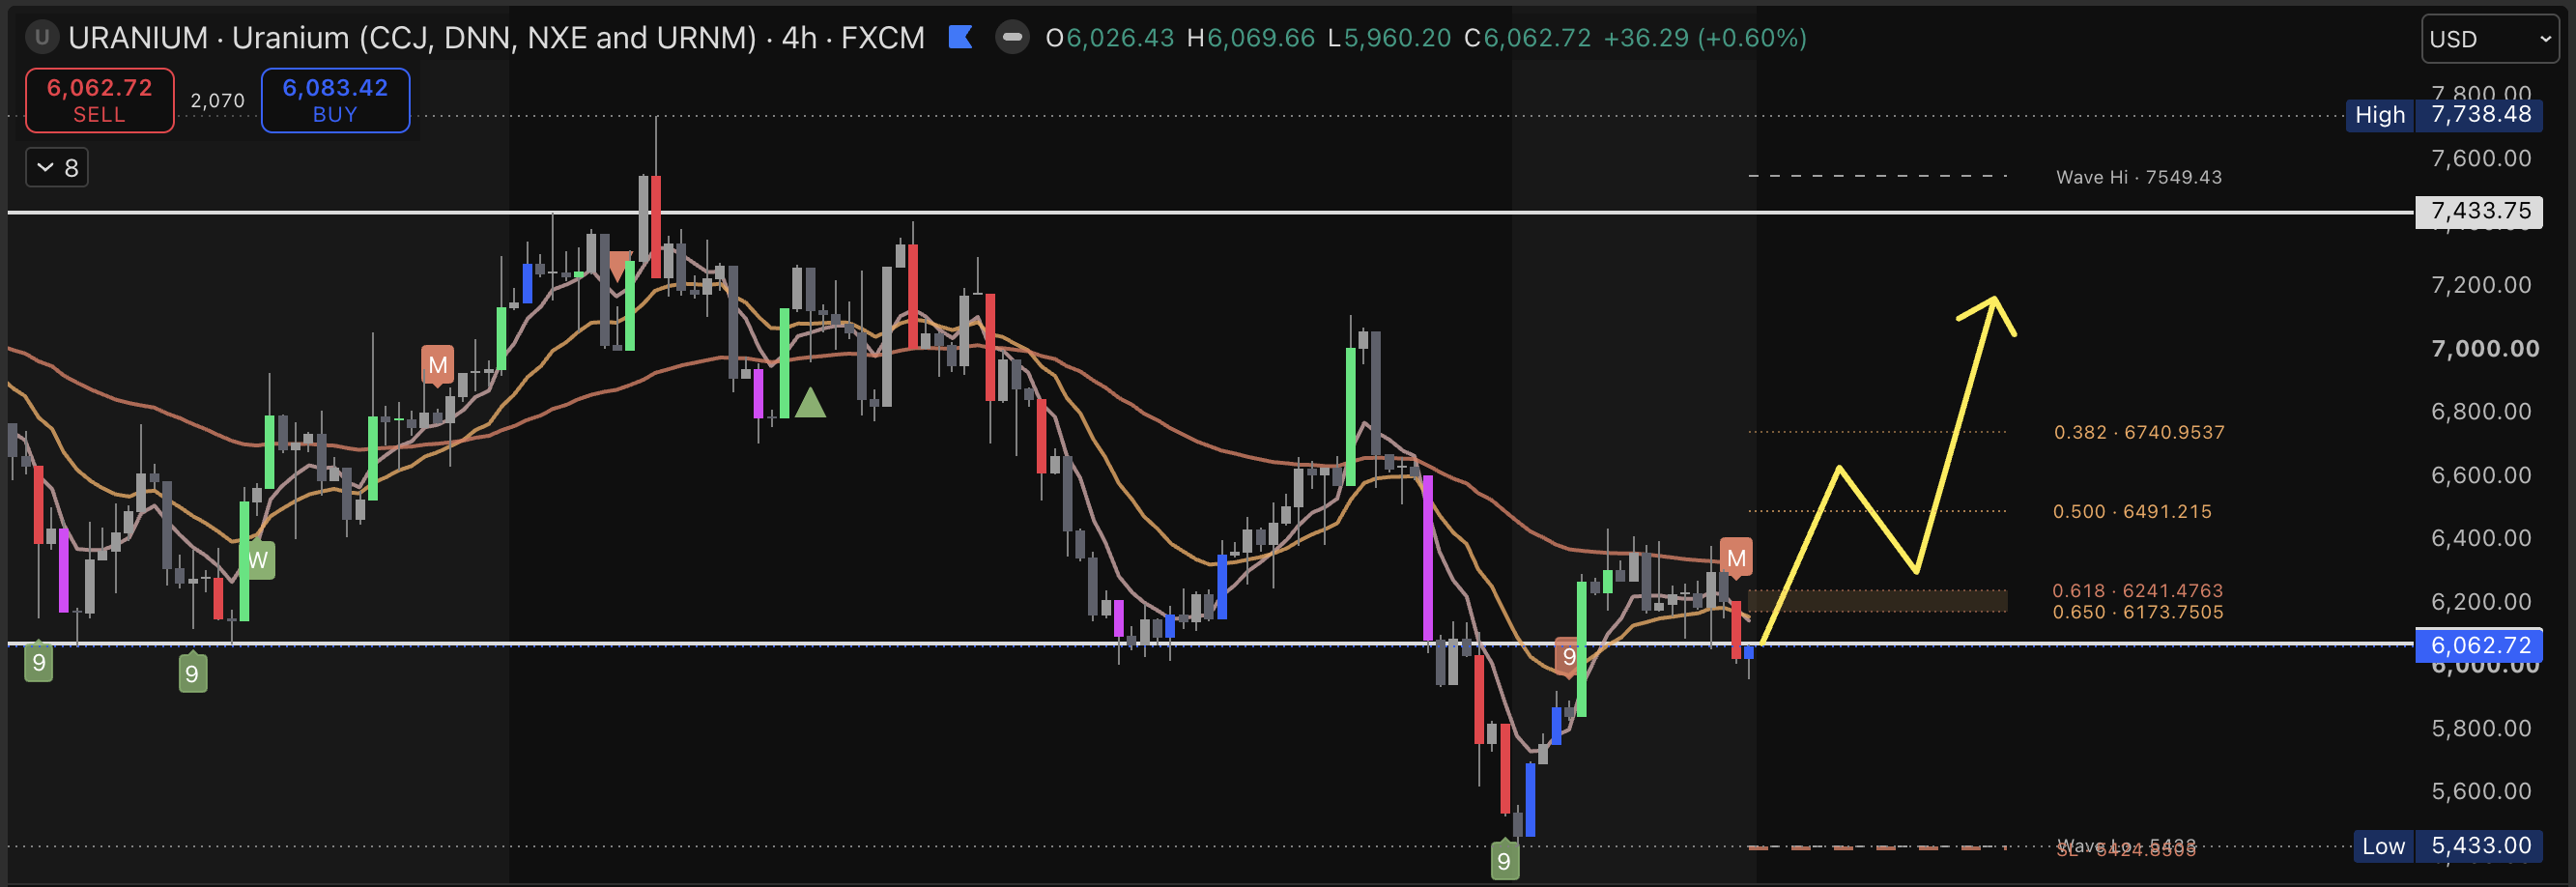
Price rocketed off that 5,433 low straight up into a wall of resistance, and in the last couple of days it's done exactly what an overstretched bounce tends to do: faded back down. We're sitting around 6,062 now, having kissed that ceiling and slipped back off it. That ceiling wasn't one wall, it was three stacked on top of each other, which is why it held:
The Fib retracement zone: Draw your Fib from the recent high down to that 5,433 low. The bounce stalled right in the 0.382 to 0.500 band - the zone where bounces inside a downtrend typically run out of steam. Textbook.
The channel ceiling: On the daily, the bounce ran straight back into the top of that downhill hallway. Resistance did its job.
The previous day and week highs: Stacked right there too, around 6,200 to 6,440.
When that many ceilings line up in the same place, the odds of price pushing straight through on the first try are low. And it didn't, it pulled back, just like the method said it probably would.
The Vibe Check
This is the part that settles it. Let me run it through what we actually look at before any trade.
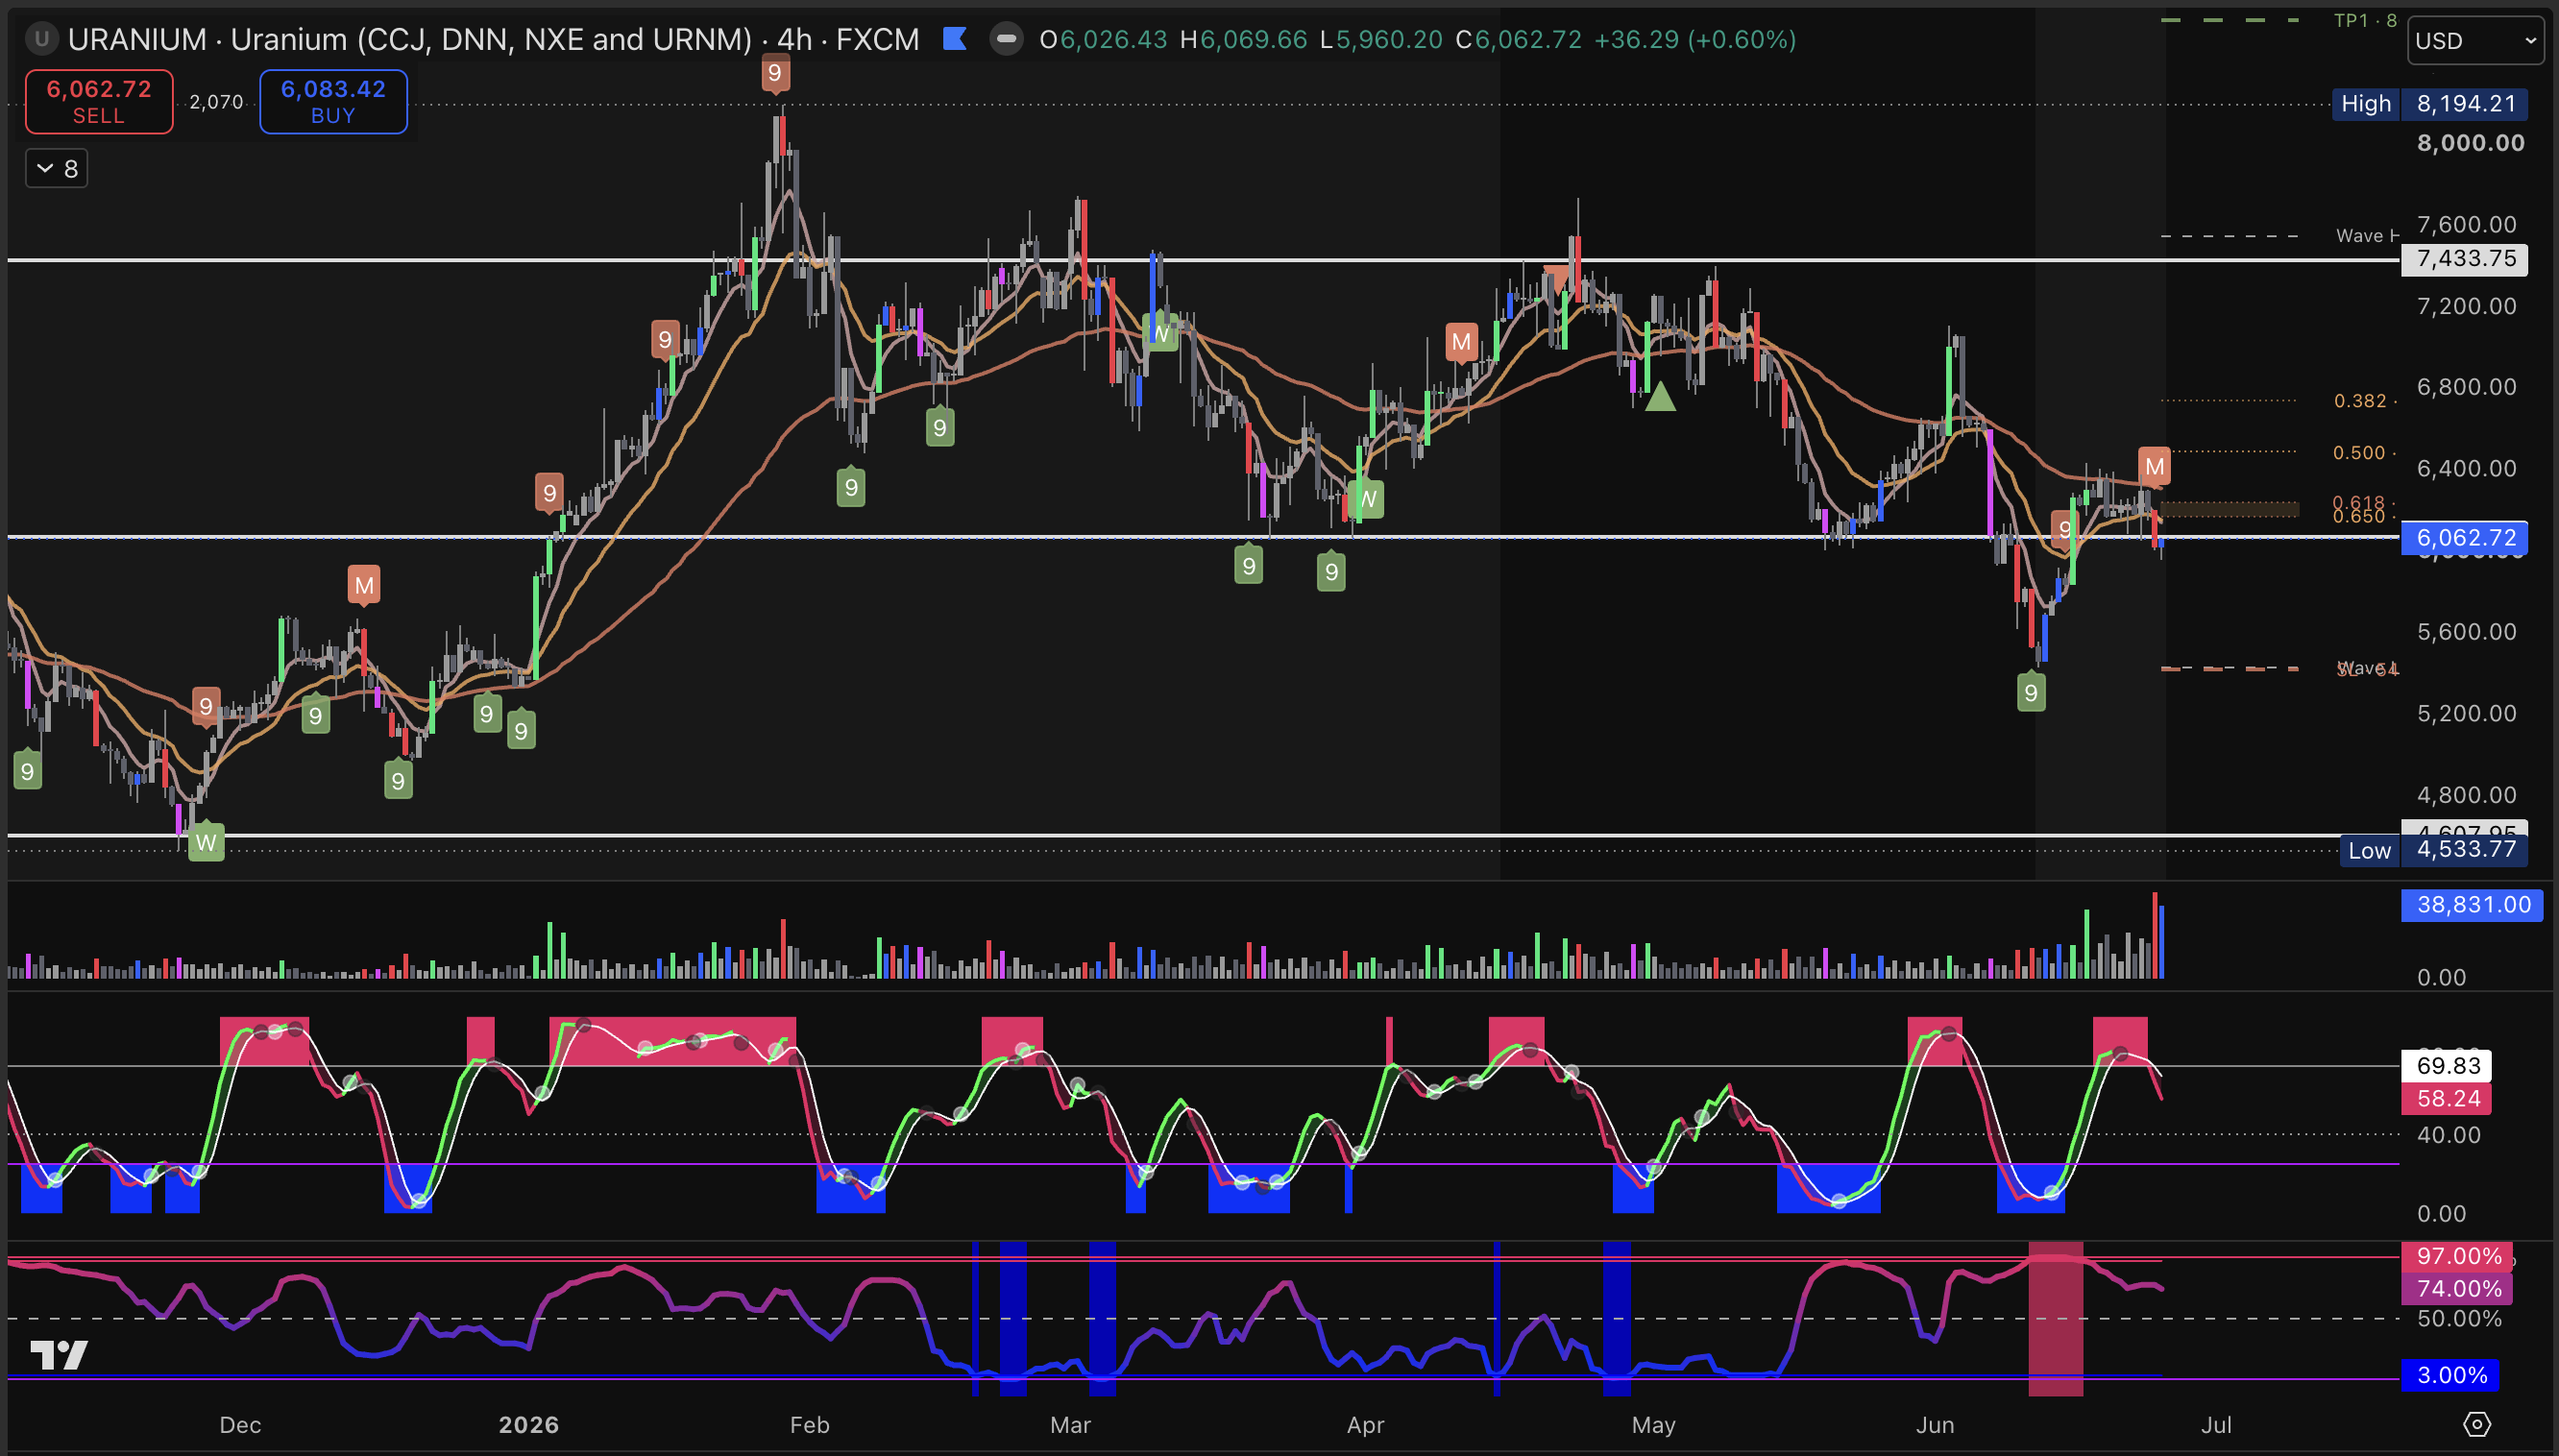
Momentum (Stochastic): This is the tell. It pushed up into overbought, that red box at the top, and has now rolled over and started turning back down. That's momentum running out of road. We buy when momentum is coiled and oversold and just starting to turn UP, not when it's tired and rolling over from the ceiling.
Volatility (BBWP): The big expansion already happened on the way up. Our rule is simple, we want volatility compressed and quiet before we get interested, because that's energy building for the next move. Right now it's still working off the bounce, not coiled.
TD9 count: The chart printed its "9" buy signal down at the lows, the exhaustion signal that the drop was done. That fired days ago and already did its job, driving this whole bounce. It's spent now.
The trend filter: The daily and weekly are still pointing down. So even with price pulling back, this is a bounce inside a bigger correction, not a fresh uptrend we'd be joining.
Put simply: the bounce we flagged a couple of days ago as "too hot, too fast" has now cooled off, exactly as the method expected. That's not a trade. But it IS the start of something more interesting, because a cooling-off is how a real setup begins to build.
The Two Scenarios
Bullish case: If price holds above 6,000 and pushes straight back up through the 6,200 to 6,440 ceiling with conviction, the bounce becomes something more serious, and the next level up is the 7,059 wave high. But it would need to do that without a proper rest first — and after a run this stretched, that's the lower-odds path.
Bearish case: This is the one that fits the bigger trend, and it's already starting to play out. The overstretched bounce ran into the ceiling and rolled back over, the pause we said was likely.
Momentum has turned down from the top. From here, the move I'd love to see is price dipping back toward the 5,800 to 5,900 zone, letting momentum reset down into oversold, and THEN building energy for a stronger push back up through 6,600 toward that 7,433 ceiling.
A clean dip-and-reset like that is a far healthier setup than the vertical chase we just watched fade. If instead price slices straight through 5,800 and heads back for the 5,433 sweep low, the correction simply isn't finished, and that's fine too. We'd just keep waiting.
What I'm Actually Watching For
I'm not entering anything here. What would make this interesting again is patience doing its job:
A pullback into the 5,800 to 5,900 zone, where price can catch its breath. Momentum resetting back down toward oversold (a fresh blue box on the stochastic). Volatility going quiet and compressed, energy building rather than spent. And then a fresh upward cross on momentum, right at that level.
That combination: buying a pullback at support, with the bigger story behind it, is a setup worth scoping. Chasing a vertical bounce into a triple wall is not.
Mom Tip: This chart is a perfect lesson in the gap between a good story and a good trade. The nuclear-and-AI story is real and it's powerful, but that story has been true all year while this chart went both up AND down. The fundamentals tell you what to keep on your watchlist. The chart tells you when. Open the daily, find that 5,433 wick and the descending channel, and just watch how price behaves around the ceiling this week. You're not placing a trade, you're learning to tell the difference between exciting and ready. They're rarely the same thing.
Frequently Asked
What is the URANIUM ticker on TradingView?
The "URANIUM" ticker (the FXCM basket) isn't the price of physical uranium. It's a basket of uranium mining stocks plus an ETF, blended into one chart. The four components are Cameco (CCJ), Denison (DNN), NexGen (NXE), and the URNM ETF.
Why is uranium going up?
Two reasons. AI data centres need enormous amounts of electricity, and nuclear is the cleanest, most reliable way to supply it. At the same time, years of underinvestment in mining left supply tight. More demand, less supply.
What is URNM?
URNM is an exchange-traded fund (ETF) that holds a basket of uranium mining companies. Buying URNM gives you exposure to the whole sector instead of betting on a single miner.
What's the difference between uranium the metal and uranium mining stocks?
Uranium the metal is the physical commodity. Uranium mining stocks (and ETFs like URNM) are shares in the companies that produce uranium. They often move together but can diverge. Right now the mining stocks have run ahead of the physical price because the market is betting on future demand.
Is now a good time to buy uranium stocks?
The long-term trend is still up, but the chart is in a correction. The story is real, but the timing matters. This piece walks through exactly what to wait for before the next setup forms.
The content in this post is for educational purposes only and reflects my personal perspective on the market. It is not financial advice. Always do your own research before making any trading decisions. I am sharing my ideas, not telling you what to do with your money.