BRENT CRUDE OIL - COMMODITY

30/03/2026
In Lesson 4 we talked about trends, candles, and timeframes. Here's all three of them showing up on a live chart - right now, in real time.
And here's the thing: the traders making money from this move right now? They're not smarter than you. They just learned this stuff before you did.
Why Is Oil Moving?
Before we look at the chart, you need to understand why oil is moving. Because the best trading lessons aren't always on the chart, sometimes they're in the news.
The Strait of Hormuz is a narrow stretch of water in the Middle East. About one-fifth of all the world's oil passes through it every single day. Think of it like a massive highway, except right now, it's effectively been shut down.
Following a military conflict between the US, Israel, and Iran that started in late February, ships have been attacked, and oil tankers have stopped moving through. Less oil moving means less supply. Less supply means higher prices. That's why Brent Crude has been climbing since early March.
Professional traders watch news like this the same way you check the weather before leaving the house. It becomes second nature. And one day - when you've put in the time - you'll open your phone, read a headline like this, and immediately know what it means for the chart. That's the skill we're building.
What the Chart Is Telling Us
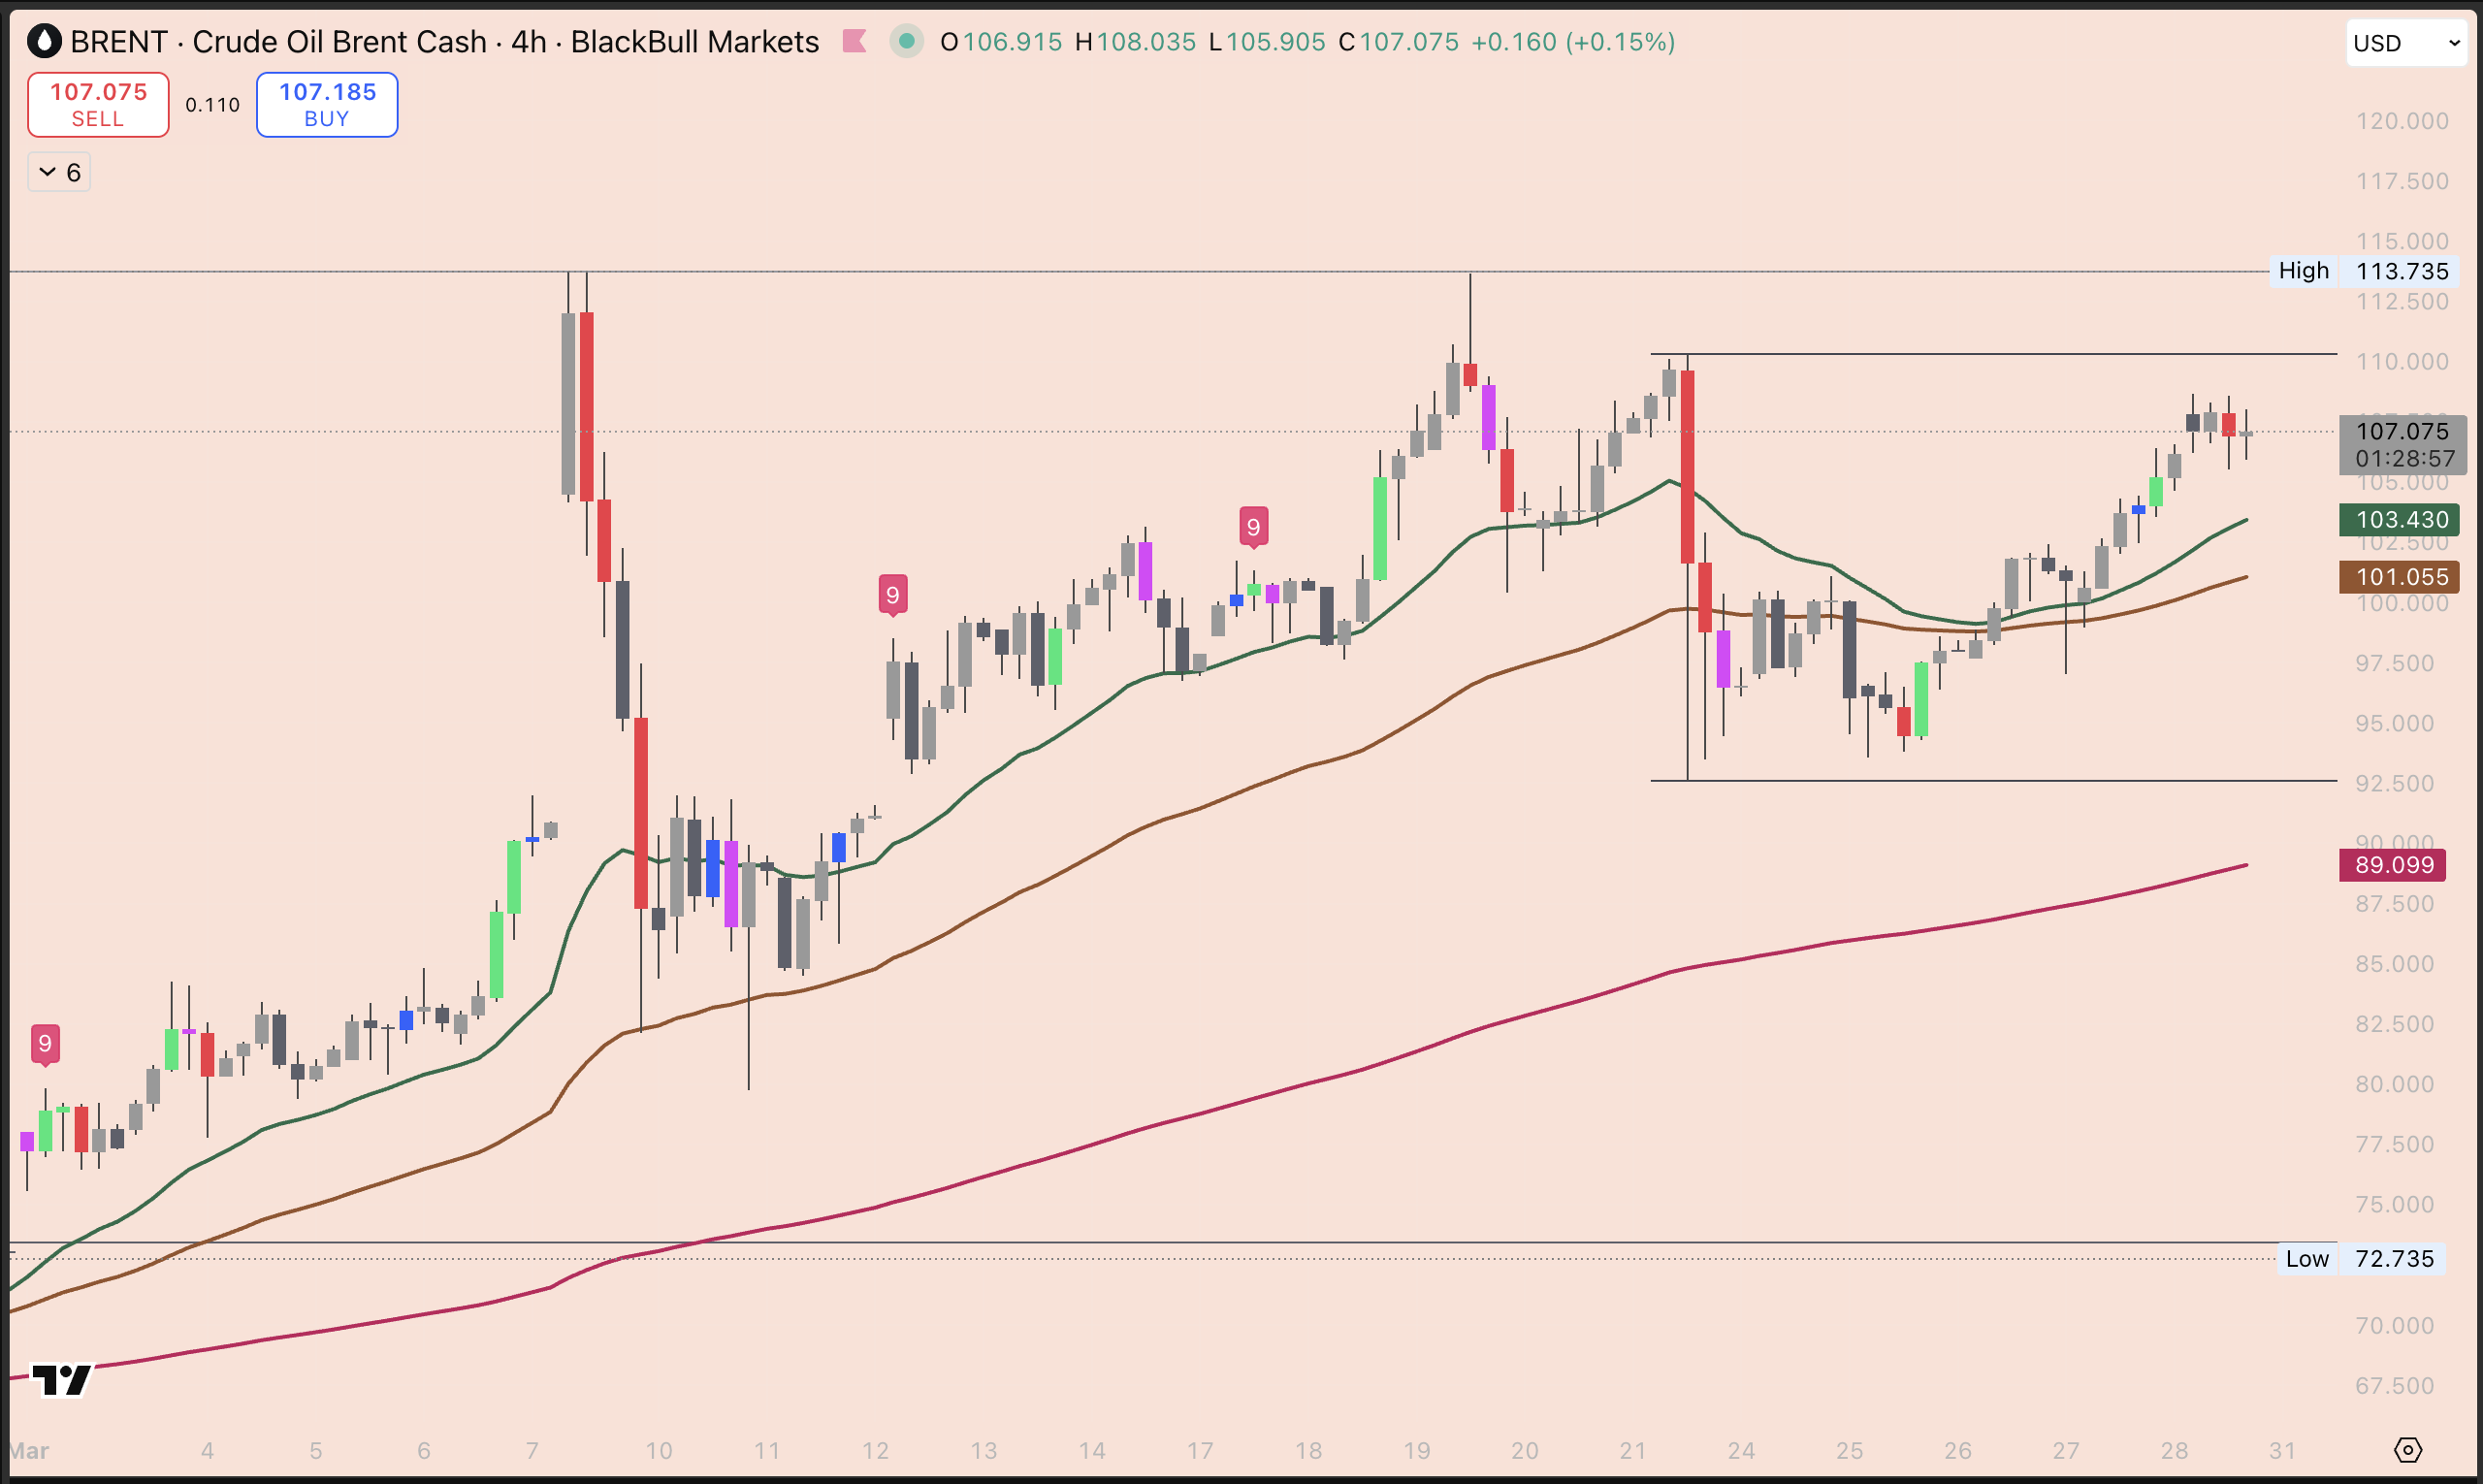
Open TradingView, type BRENT in the search bar at the top, and select Brent Crude Oil. Set the timeframe to 4H (4 hour) using the buttons along the top of the chart. Don't worry if it feels unfamiliar; we're doing a full TradingView walkthrough in an upcoming lesson. For now, just get it open and look at the overall shape from left to right.
Remember what we said about uptrends? Higher highs and higher lows — like climbing stairs. That's exactly what you're looking at here. From the start of March through now, the candles have been making higher highs overall. Buyers have been in control.
You'll also notice three curved lines running underneath the candles - green, brown, and red. Don't worry about those for now, we'll cover them in a future lesson. But notice how the candles keep bouncing off or hovering around them as the price climbs. That's not a coincidence - and you'll understand exactly why soon.
Now look at where the candles keep pausing or bouncing. You'll notice the price has reacted around the $100–$103 zone more than once - stopping there, bouncing from there. That's the market showing you a level that matters. Price has memory. The same buyers and sellers keep watching the same levels, which is why they keep reacting there.
Above where we are now, watch the $110 and $113 areas. Those are where the candles have previously hit a ceiling and pulled back.
You just identified three meaningful levels on a live commodity chart. That is not nothing.
The Two Scenarios
Brent is currently around $107.
If the Strait stays closed, the uptrend has room to continue toward those ceilings we just identified.
If there's a ceasefire or the Strait reopens - expect the candles to start telling a different story, fast. A move back toward that $100–$103 zone wouldn't be surprising at all.
This is why we learn to read trends and follow the news. Neither one alone gives you the full picture. But together? That's how traders make decisions with confidence - not guesswork.
Imagine sitting at your kitchen table six months from now, opening your phone, reading a headline about a conflict in the Middle East, and knowing exactly what to look for on a chart. That moment is closer than you think - but only if you keep showing up.
Mom Tip: Don't trade this one yet. Use it as practice. Look at the chart, identify the trend, find the levels where candles have reacted before. You learned exactly how to do that in Lesson 4. This is you applying it to a real asset, in a real market, driven by real events. That's the whole game.
WELL DONE! You're already a better trader than you were yesterday.
The content in this post is for educational purposes only and reflects our personal perspectives on the market. It is not financial advice. Always do your own research before making any trading decisions. We are sharing our ideas — not telling you what to do with your money.