TESLA - US - Stock
25/02/2026
TRADE SET UP
Time frame: 4hr
Risk/Reward: 4:93
Entry: Between $399 - $403
Stop Loss: $388.22
Take Profit: Around $425 (TP1) & $455-$457 (TP2)
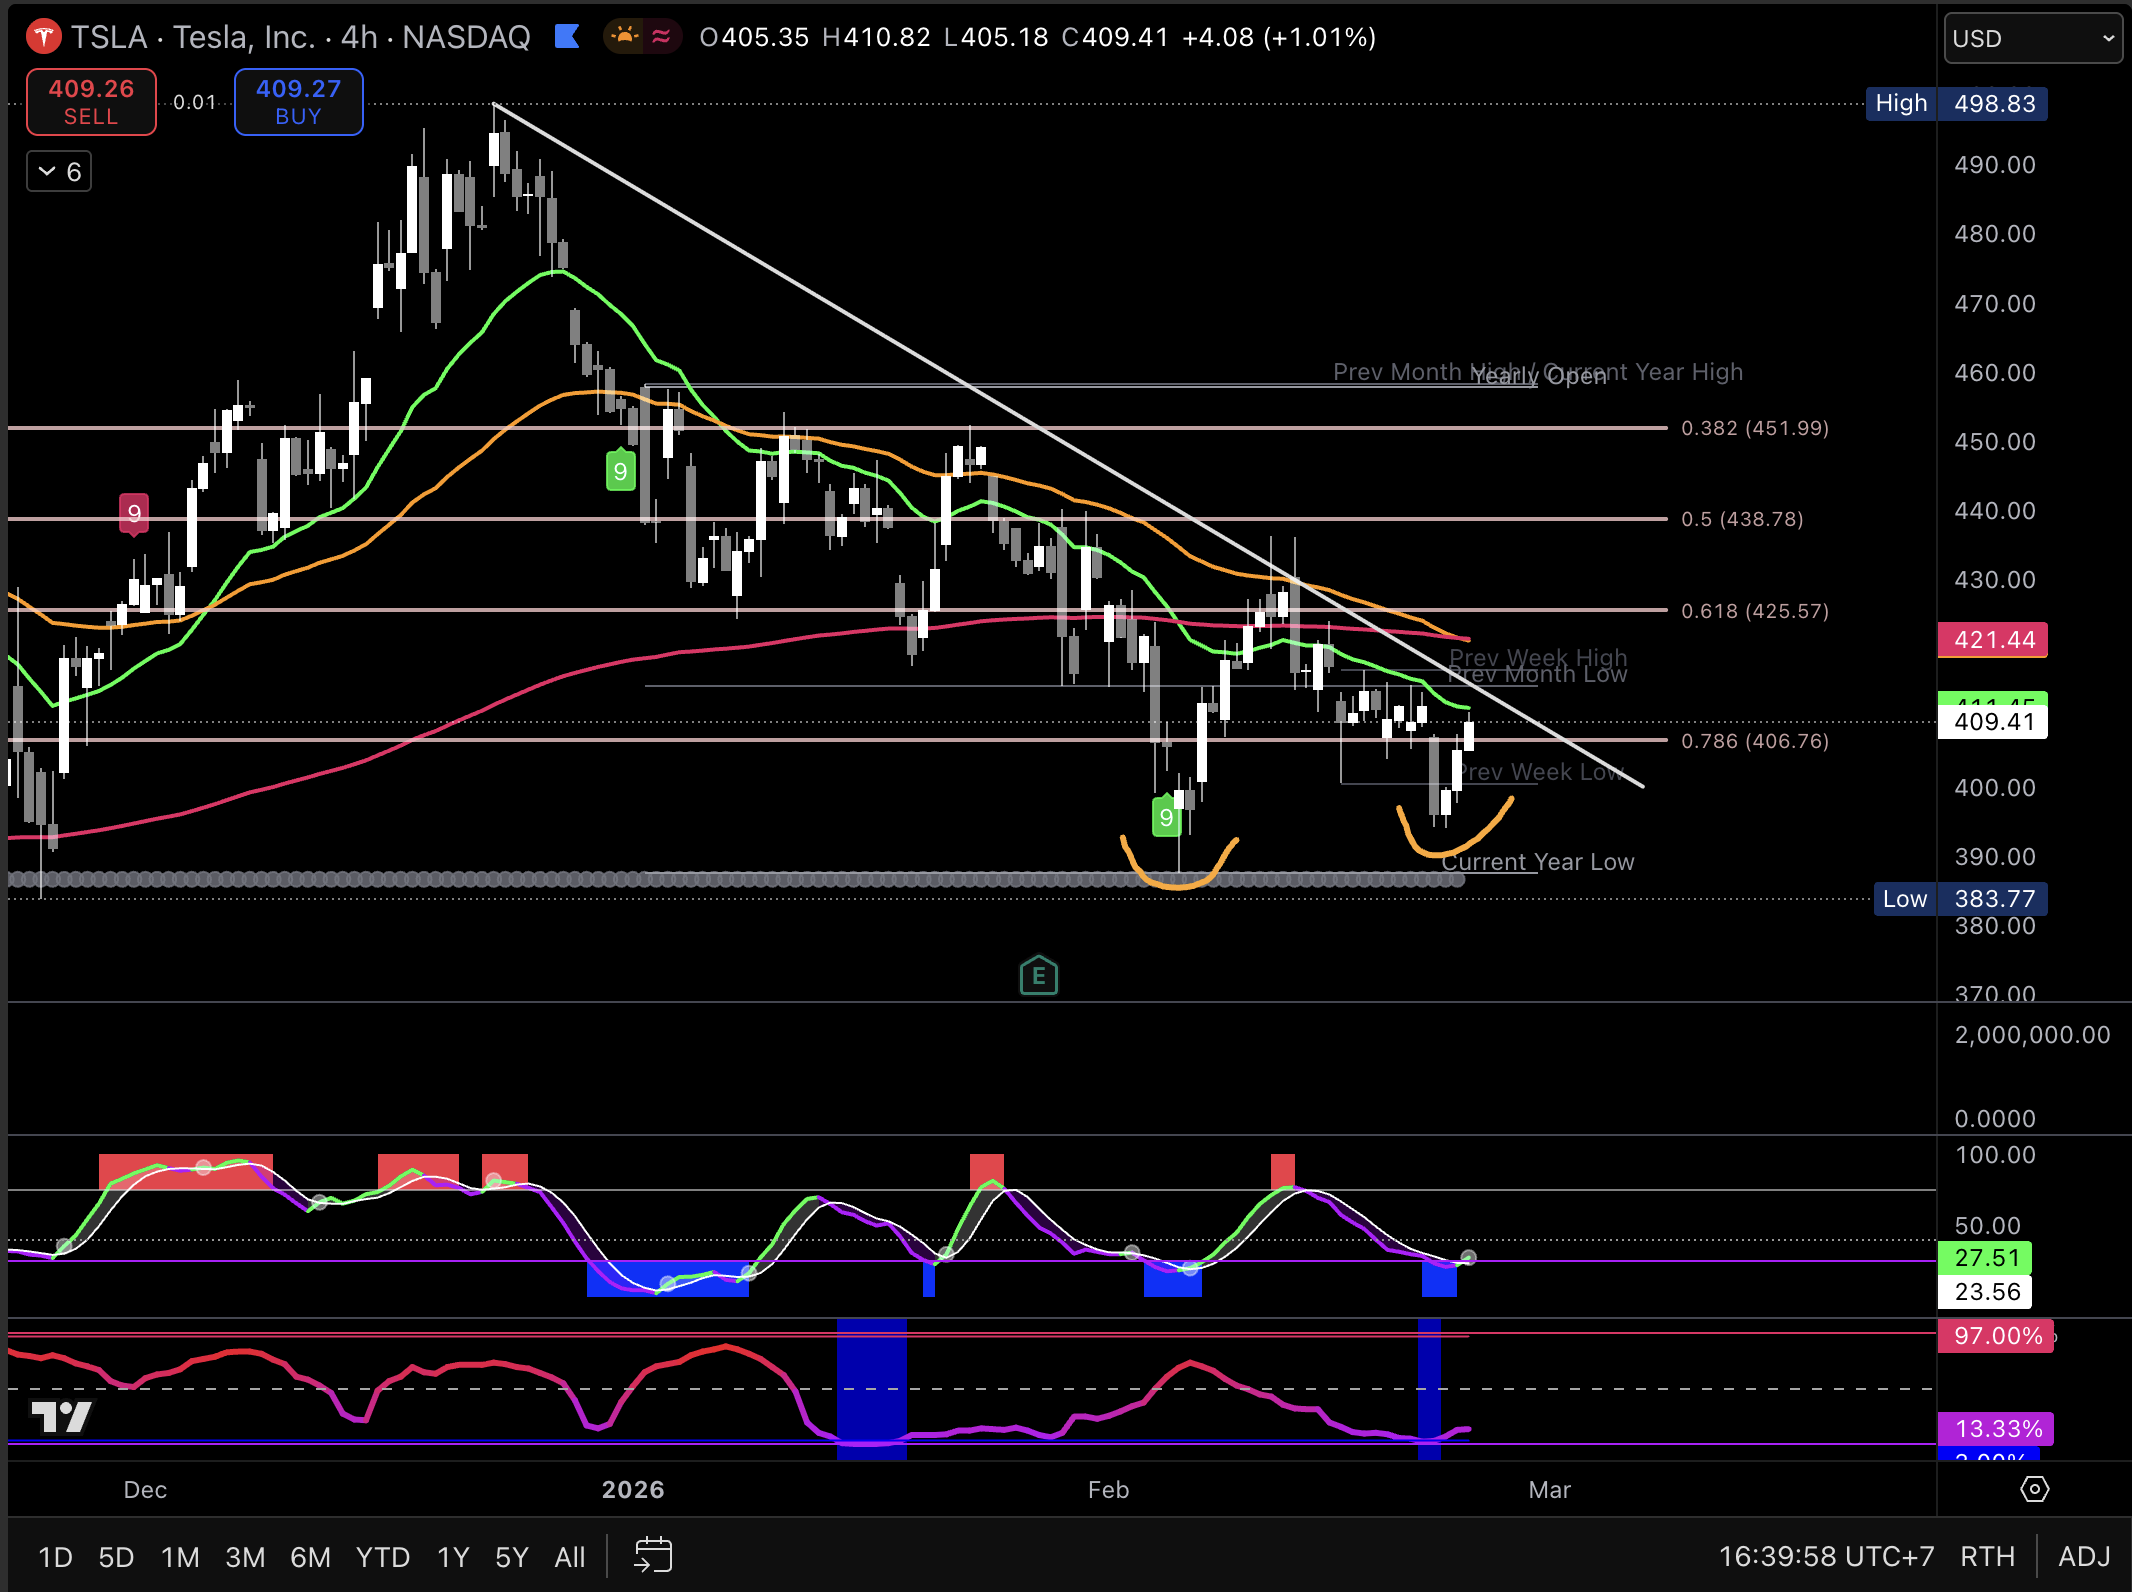
The Big Picture (Current Price Action)
Tesla has had a volatile 24 hours. After closing yesterday at around $409.40, the stock is seeing some "mixed signals" this morning. While the broader tech market is up thanks to AI sentiment, Tesla is wrestling with the fallout from last night's speech.
President Trump doubled down on his "America First" agenda, explicitly touting the end of the "insane electric vehicle mandate" and calling for a focus on gasoline and hybrids. While he mentioned he "likes Elon," his policy shift away from EV subsidies is a headwind the chart is currently trying to process.
Key Levels (The Floors and Ceilings)
Just like our Bitcoin analysis, we have clear boundaries where the "moms who trade" are watching for a move:
- Critical Support (The Floor): $398 – $400. This is the psychological "must-hold" level. We saw a bounce from $398.14 yesterday. If we break below $394, the next big safety net is the 200-day moving average way down at $383.86.
- Major Resistance (The Ceiling): $420 – $427. This is a "traffic jam" zone where several key moving averages (the 20-day and 50-day) are clustered. We need to see Tesla clear $427 with high volume to prove the bulls are back in charge.
- The Next Target: If we can bust through that $427 ceiling, the next major "profit-taking" zone sits near $454.
Momentum & Trend Check
- The Trump Factor: The speech was a bit of a "double-edged sword." While his support for AI is great for Tesla’s Robotaxi and FSD (Full Self-Driving) dreams, the removal of EV tax credits makes the cars more expensive for the average family, which can hurt sales volume.
- The FIB (Fibonacci): The stock is currently trading below its medium-term "golden" levels. It’s in a bit of a "no man's land" between the long-term support ($383) and the recent highs ($436).
- Momentum: The RSI (Relative Strength Index) is sitting around 42-48, which means the stock isn't "oversold" yet, but it’s definitely leaning more bearish than bullish at the moment.
Prediction & Thoughts
Right now, the market is "digesting" the news. The 4-hour chart shows Tesla is trying to form a base.
My Take: Expect some choppy sideways action between $400 and $420 for the rest of the week. If the market feels the AI tailwinds from other tech giants are stronger than the "EV mandate" drama, we could see a push back toward $430. However, keep a tight stop-loss near that $394 level—if that breaks, the slide to $383 could happen fast.
The Game Plan: The "Higher-Low" Hunt
Think of this like waiting for a sale at your favorite store. The price dropped yesterday, and now we’re waiting to see if it "retests" that low area without falling through. If it stays higher than yesterday's bottom, it’s a signal that the buyers are moving back in!
Why We’re Waiting for the US Open:
The morning "open" (9:30 AM EST) is usually when the big institutional traders make their moves.
- The Pullback: We want to see the price dip a little bit after the bell rings.
- The Higher-Low: If Tesla dips but manages to stay above yesterday’s low of $398, and starts moving back up, that’s our green light!
Mom Tip: Watch the volume today. If we see big green bars during the bounce, it means the "big players" are buying the dip despite the political headlines.