SOLANA - US - Crypto
15/09/2025 UPDATE
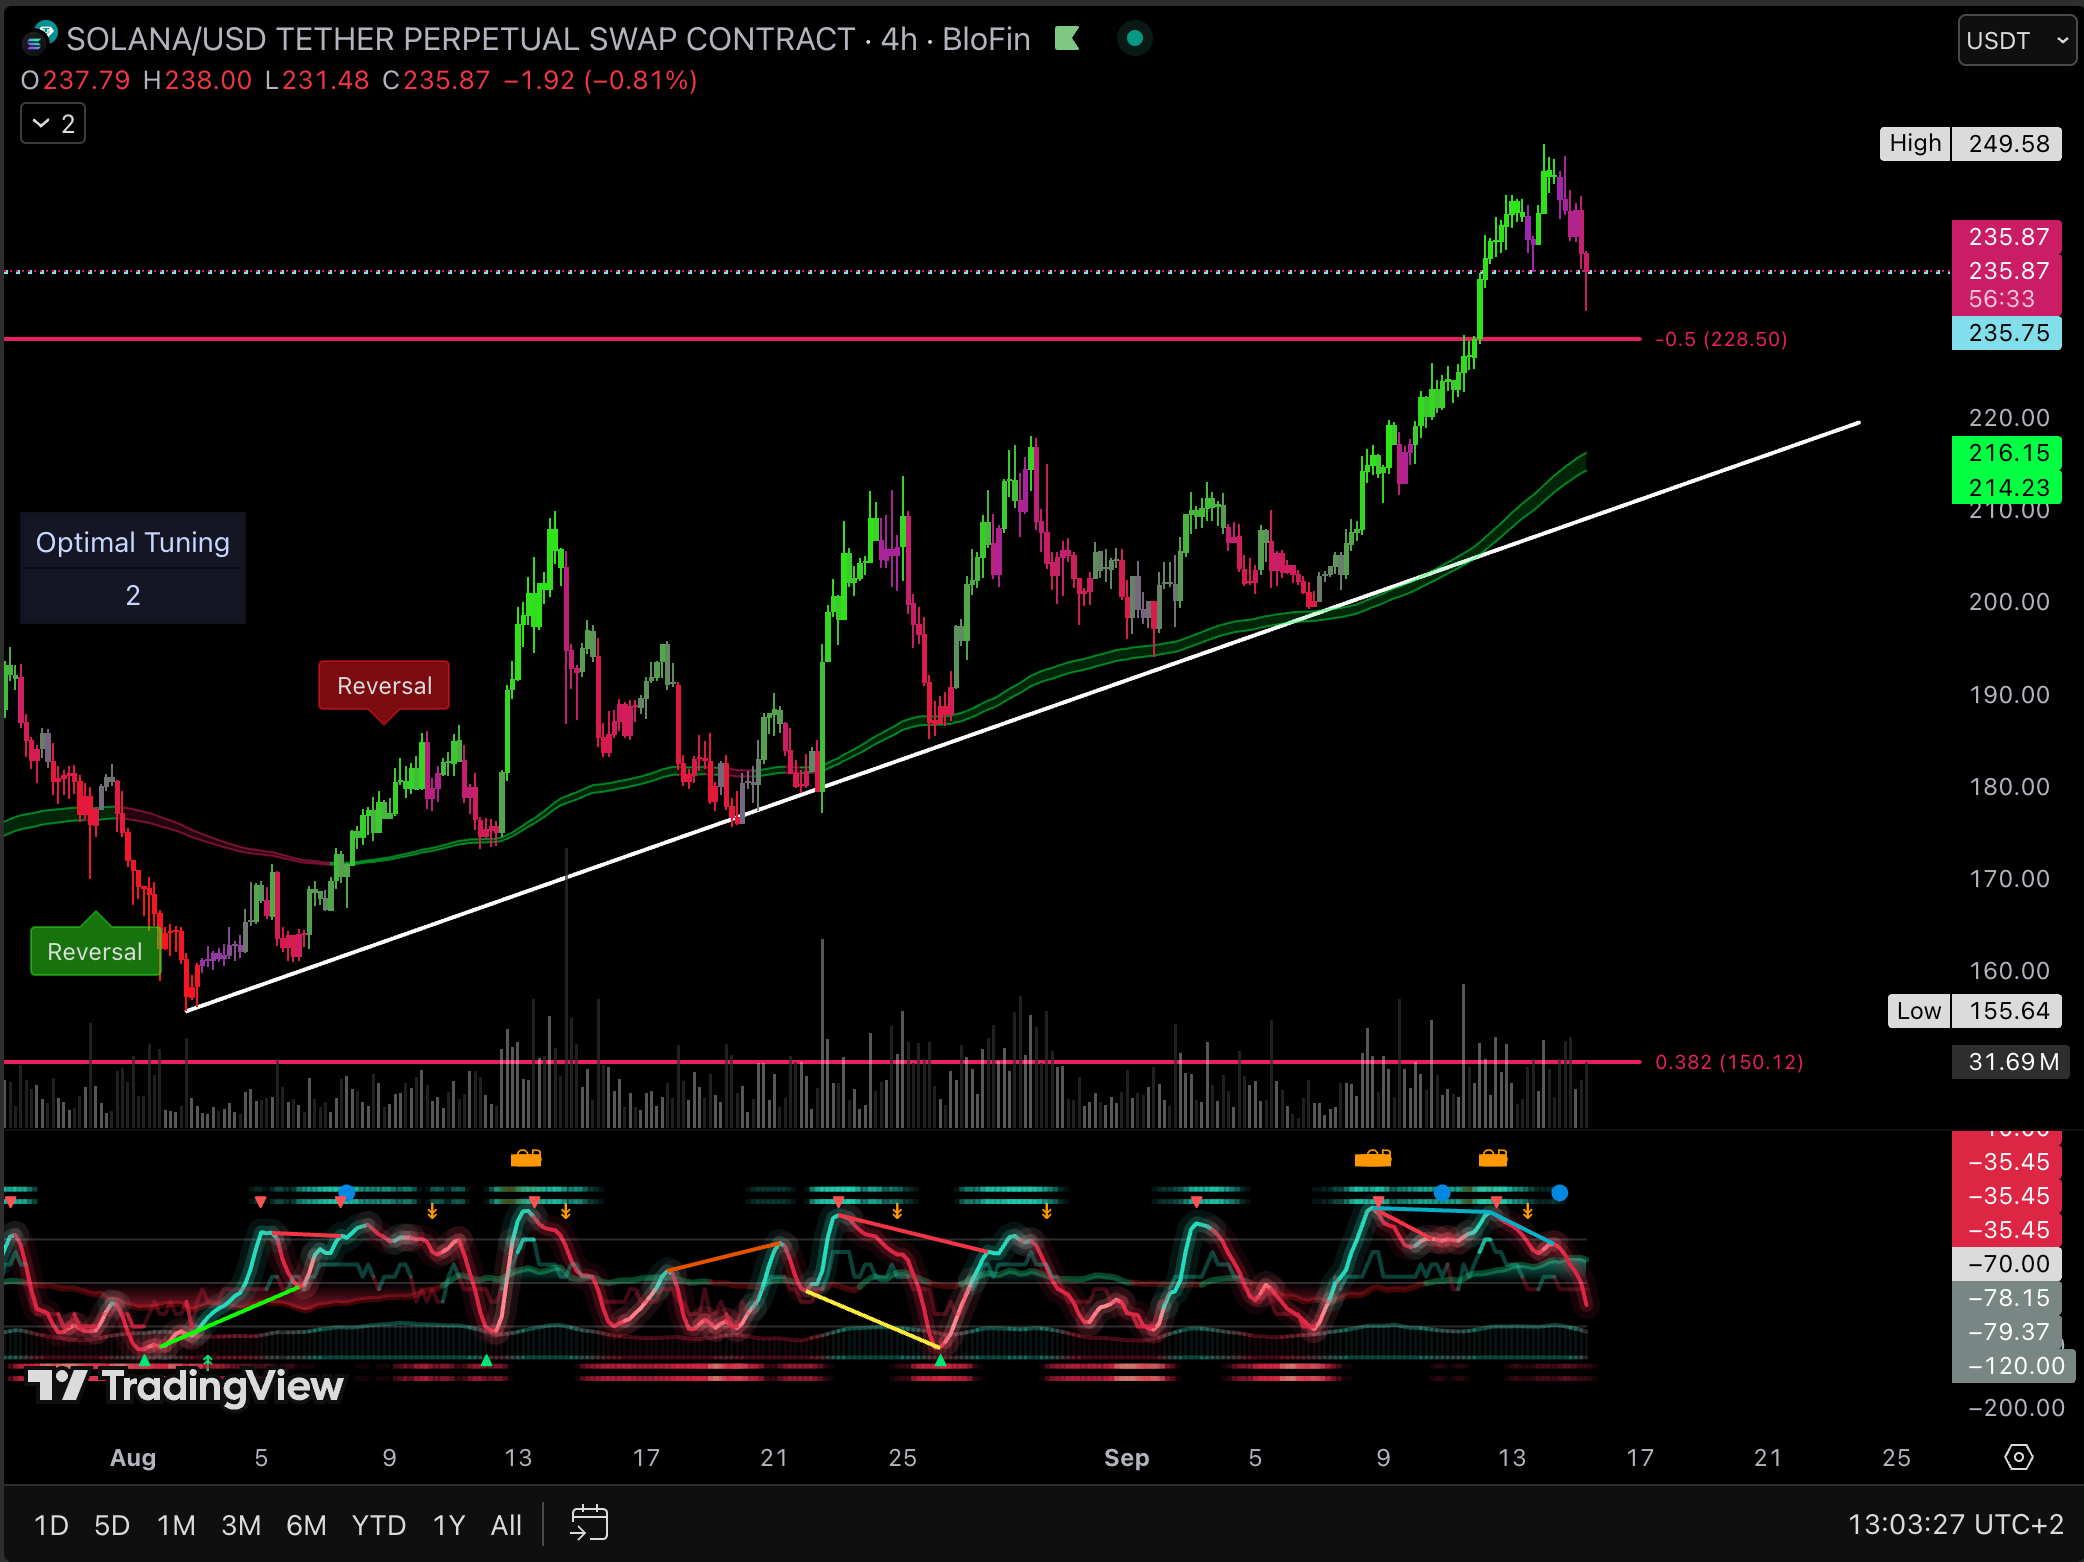
Hey ladies, let's take a quick look at what Solana (SOL) is doing!
Basically, SOL has been on a fantastic run since August, climbing a steady staircase up. We love to see it! 📈
Right now, the price is taking a little coffee break around the $235 mark after almost touching $250. This small dip is totally normal—think of it as catching its breath before the next move.
Here’s the simple breakdown:
- Our Safety Net (Support): That solid green line climbing up the chart is our best friend. As long as the price stays above that line, the uptrend looks healthy.
- The Next Hurdle (Resistance): We need to stay above $220, so w're going to keep a close eye on it this week. If we bounce between $220 - $235 we are in for nice climb to $260. I don't expect a big pull-back on the charts.
- What to Watch For: Don't stress about today's little red candle. We're just watching to see if the price can hold steady above $230. If it does, it might be gearing up for another push.
TRADE: If you are looking to buy SOL, I would have two limit orders at $228 and $217. My StopLoss would be around $210
So, the overall vibe is still bullish! We just might see a small pullback to test our support before the next leg up. Stay patient and happy trading! ✨
28/08/2025 UPDATE
What's Happening with Solana? (A Quick Look!)
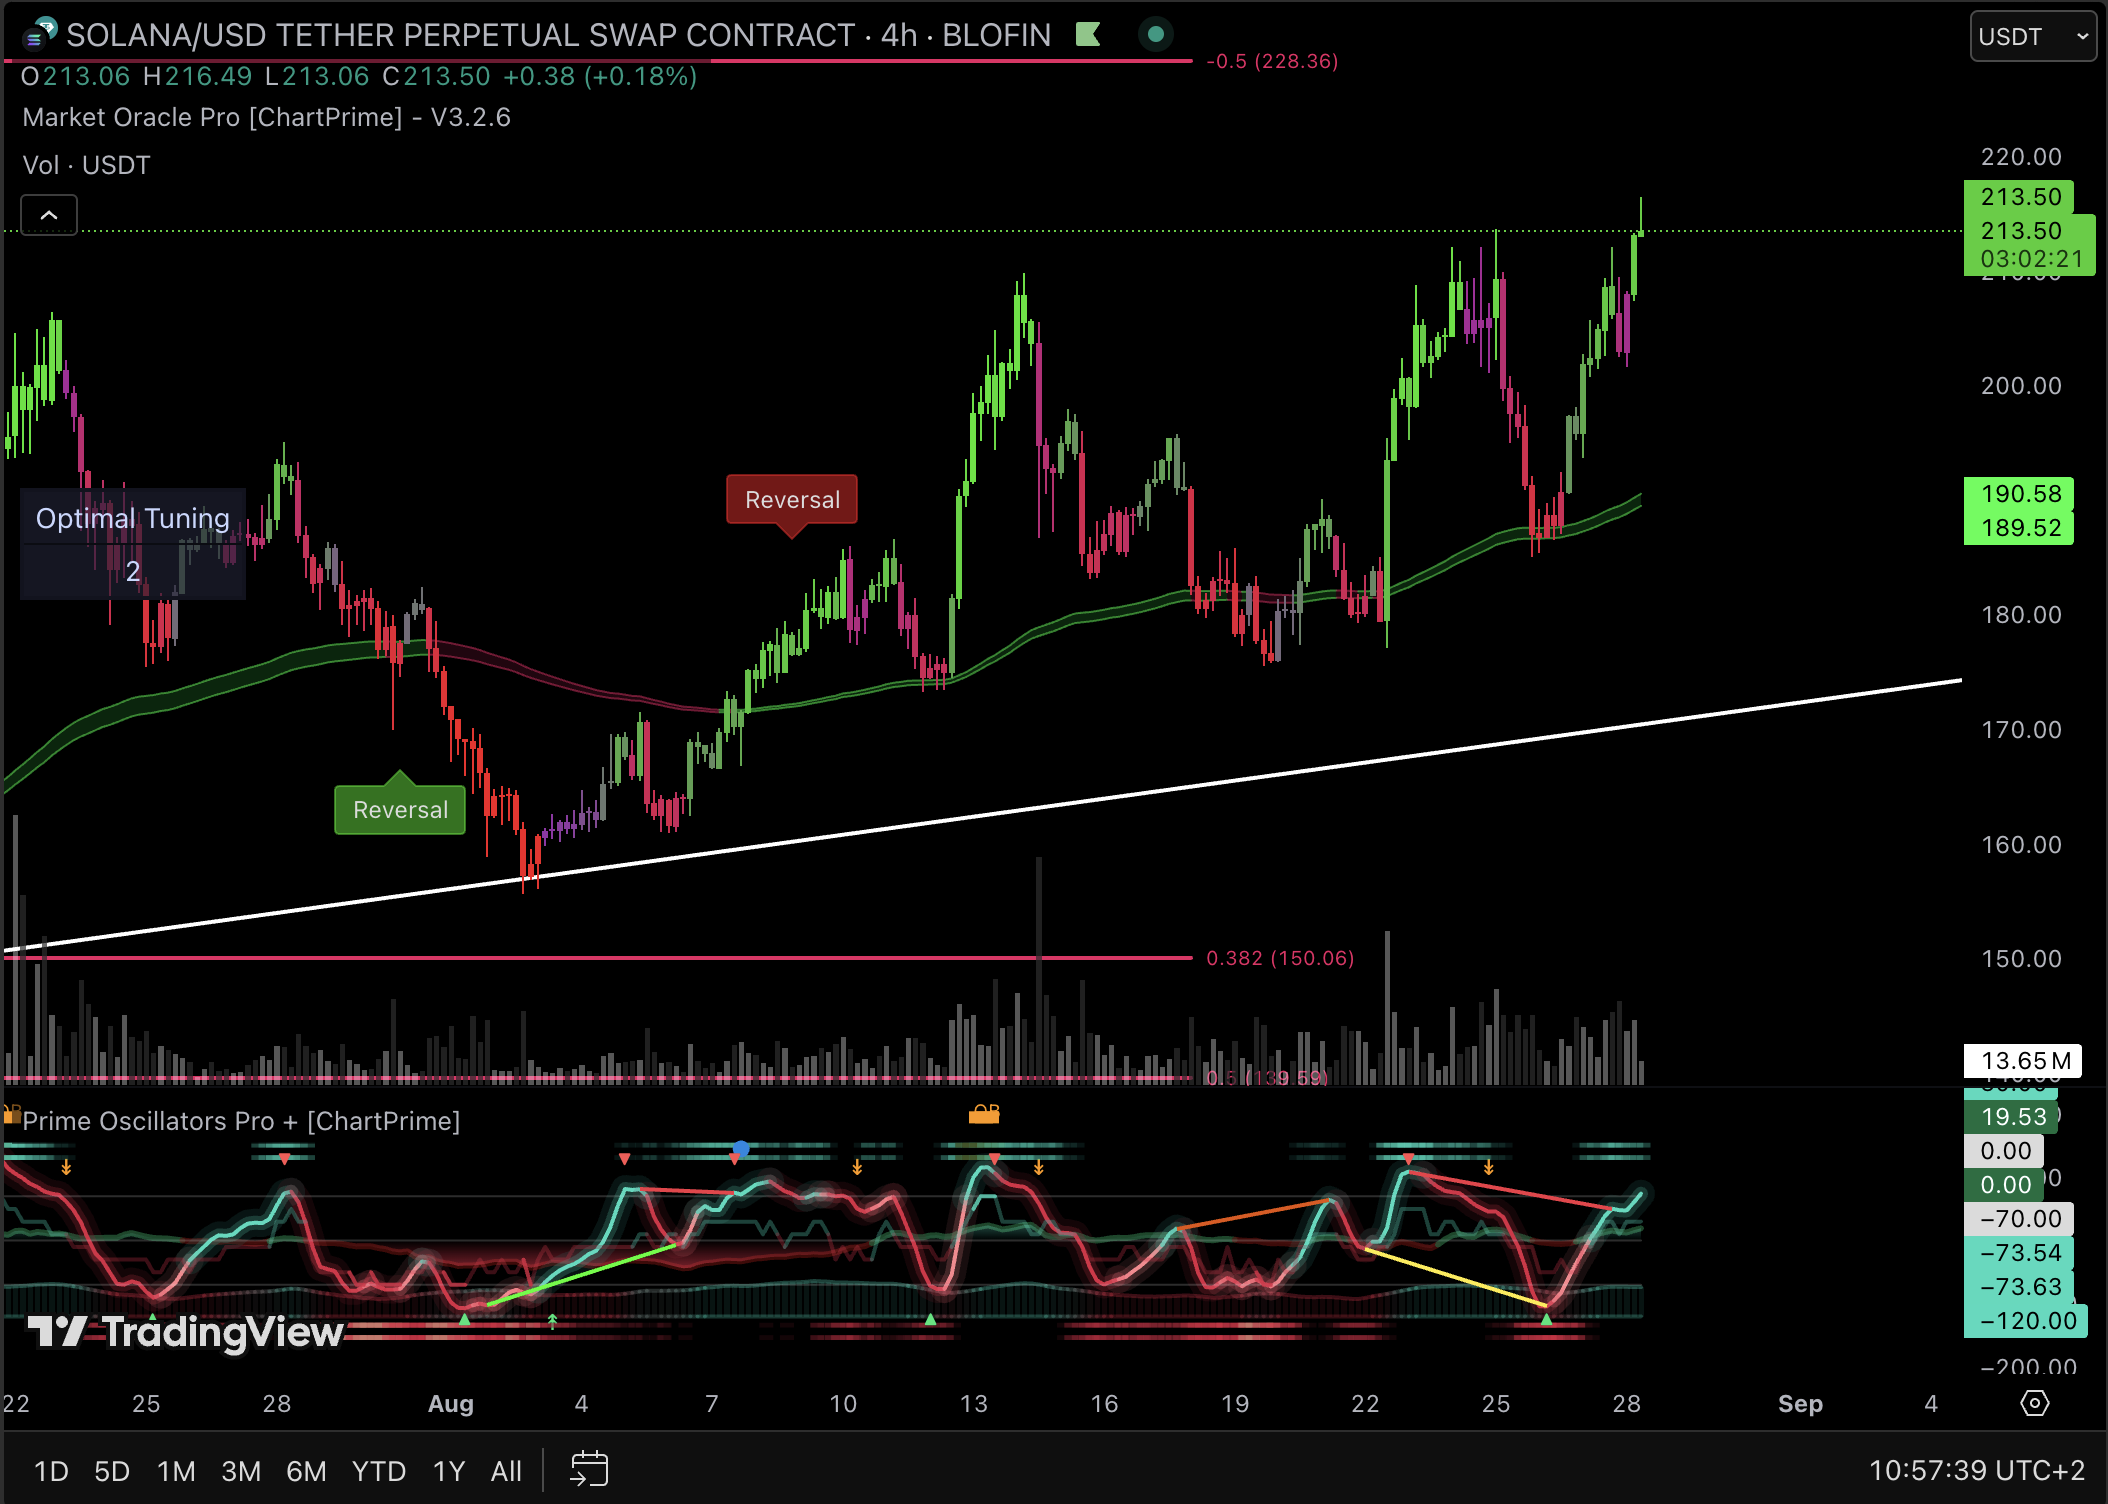
Hey mamas! Let's take a quick peek at the Solana chart.
Right now, things are looking pretty great! Think of it like SOL is successfully climbing a staircase, making steady steps up since early August. It's looking strong and confident.
- The Green Line is Our Friend: That solid green line on the chart is acting like a trampoline. Every time the price dips down to touch it, it bounces right back up. This is a super healthy sign that our upward trend is going strong!
- Good Buying Energy: See those tall green volume bars at the bottom? That’s like a crowd cheering our climber on! It shows that lots of people are buying in and pushing the price higher, which we love to see.
Okay, But What Should We Watch For?
Now, for a little bit of mom-level caution. You know how a toddler can be running full speed but you can just tell they're about to run out of steam? That’s what the indicator at the very bottom might be telling us.
Even though the price is making a new high, the momentum indicator is making a lower high. This is called a bearish divergence. It doesn't mean we need to panic! It's just a little heads-up that SOL might be getting a bit tired and could need a little rest (a pullback) soon.
Simple Breakdown:
- The Vibe: Bullish and happy! 📈
- The Floor (Support): If it takes a breather, we’ll first look for it to stay above $210. Its main trampoline support is way down at $190.
- The Ceiling (Resistance): It's currently trying to break through $216, trying to make its way to the FIB 0.5 around $227/$230.
- Heads-Up: Keep an eye on that sleepy momentum indicator. It’s telling us to watch for signs of it getting tired.
Hope this helps, mamas! Happy trading! 💚
12/08/2025 UPDATE
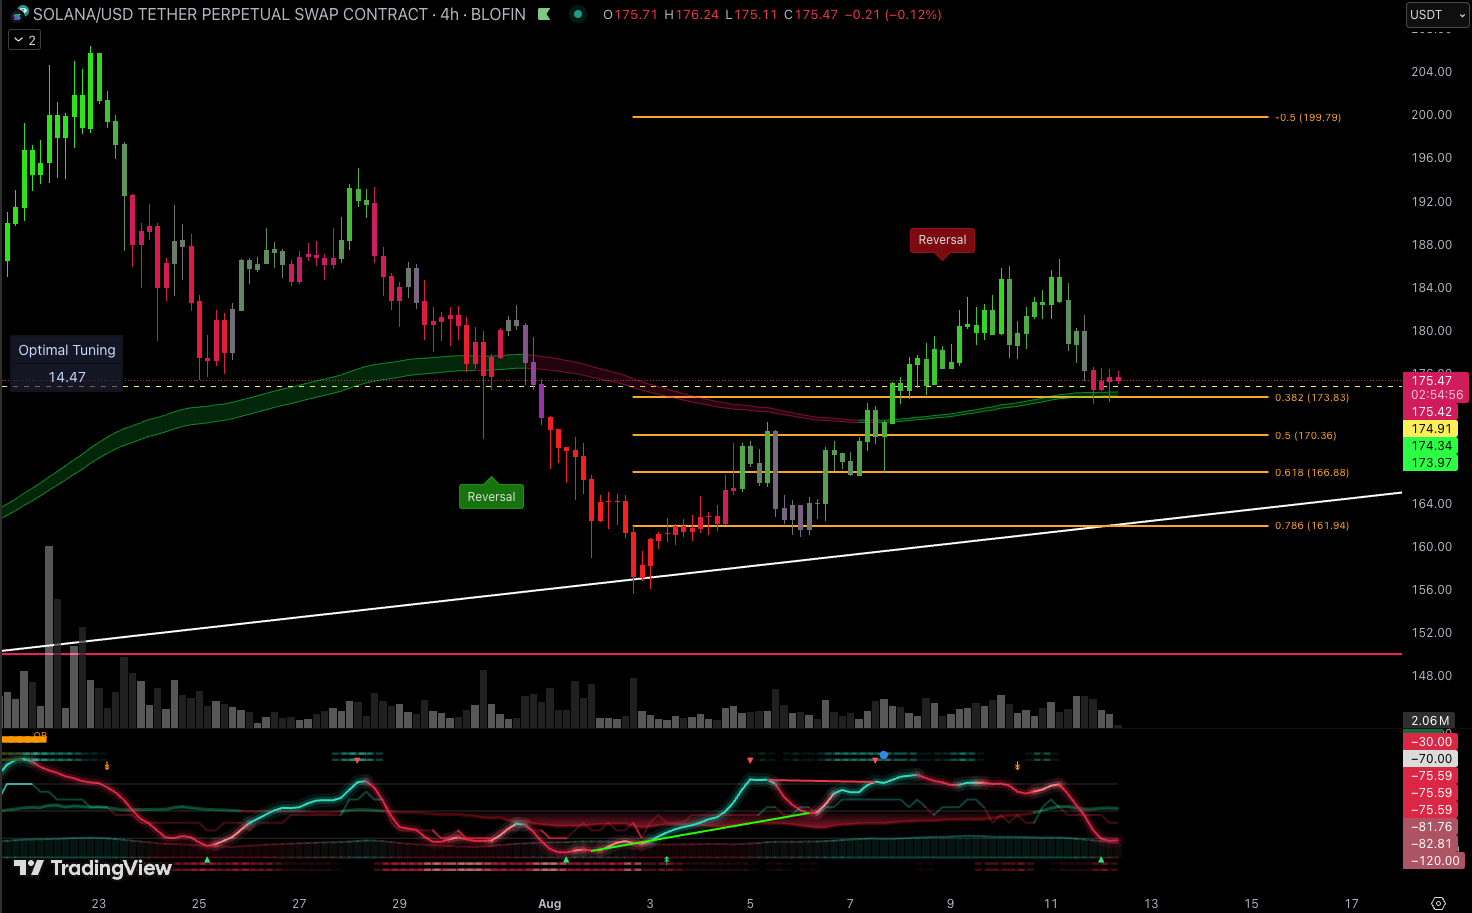
Current Price Action
Solana’s now at the FIB 0.382 level ($174). This could either be a spot to push higher or face some selling pressure.
Support and Bounce Levels
The FIB 0.618 ($166) is a solid bounce area because it’s a classic support level where buyers often step in, especially with the nearby upward white trend line. That trend line acts like a safety net, showing the price has historically bounced off it, adding extra strength to the $166 support. If it holds there, we might see a climb back toward $200.
Market Mover Alert
Today, the US CPI number is released at 8:30 AM ET, which typically triggers significant price swings in the market, but also creates potential entry points.

Stay sharp, and happy trading! 💪
04/08/2025
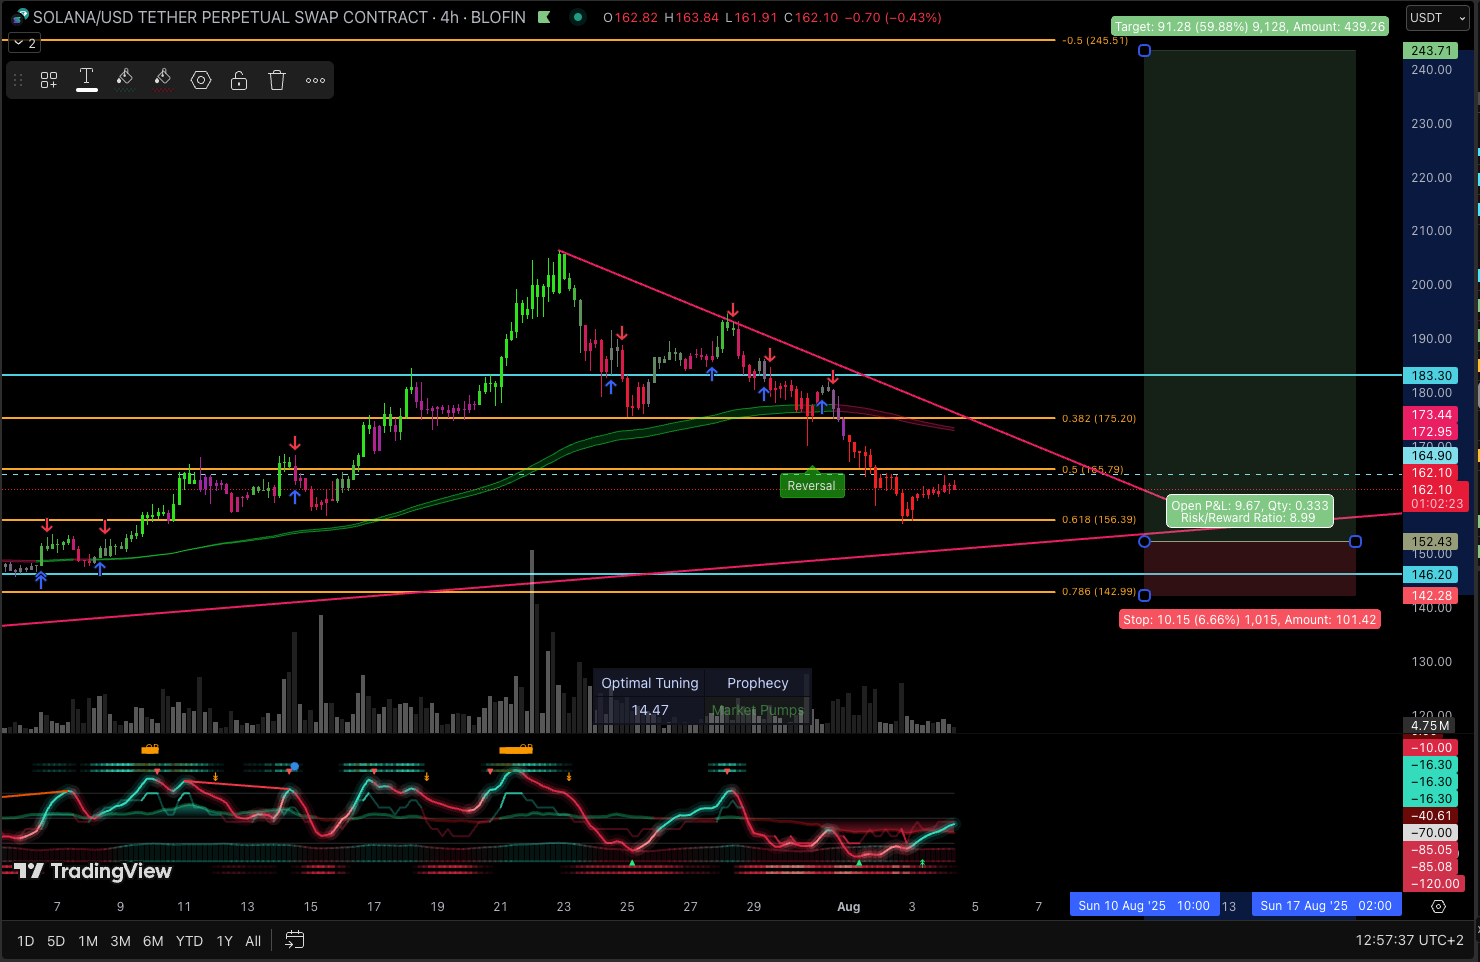
Name of asset : SOLANA - US
Asset Category: Crypto
Time frame: Daily - 4hour
Risk/Reward: 8.99
Entry: $152.43
Stop Loss: $142.29
Take Profit: $243.71
Hey amazing MomsWhoTrade Community,
Today, we're looking at Solana (SOL), a popular cryptocurrency. This chart has some really interesting points, especially with a potential trade idea shown right on it. Let's explore!
The Big Picture (Recent Movement):
- Solana had a fantastic run-up in July, but it's been pulling back quite a bit recently. The blue lines are Support & Resistance lines. SOL has lost support on the mid-level of those lines. There are still no "higher lows" on the 4hour, which would be a good indication of a reversal.
Key Levels (Where the Action Is):
- The price is currently hovering around $161. Breaking through the 0.5 Fib and bouncing on the 0.618 (Golden Pocket). These are considered very strong support areas where prices often find a "floor" and bounce.
- Further down, the 0.786 Fibonacci level ($142.99) is another important support, which lines up perfectly with the "safety net" shown.
Trend Lines
- The red diagonal lines in red are the trend lines. As you can see we haven't tested the bottom line yet or even broken through the top one. This would indicate a continuation in a downward trend. We would then wait to see a "Higher Low" form which would indicate a possible reversal.
Momentum Check (The Bottom Indicator):
- The momentum indicator at the bottom of the chart has moved into the lower, "oversold" region. This often means that the selling pressure is easing up, and the asset might be due for a bounce back up. It also appears to be starting to flatten out, which can be an early sign of a potential reversal.
Volume Speaks Volumes:
- During Solana's big rally earlier in July, we saw strong volume (the tall bars at the bottom), indicating lots of buying interest.
- However, during this recent pullback, the volume has generally been lower. This is a good sign! It suggests that the selling isn't being done with huge conviction, and it might just be profit-taking rather than a fundamental shift, making a bounce more likely.
My Trade Idea (Based on this Chart's Setup):
- I am waiting to see a reversal on SOL and a possible bounce on the trend line. Alternatively you could wait for a breakout on the top red line before entering - around $164/$165.
Risk vs. Reward:
- This setup presents a very favorable risk-to-reward ratio. The potential gains (the tall green box) are significantly larger than the defined potential loss (the small red box), which is a key part of good trading strategy!
Important Reminder: This isn't financial advice. Trading involves risk, and you could lose money. Always do your own research, understand the risks, and only invest what you're comfortable losing. The crypto market can be very volatile!
Let's keep learning and growing together!