NATURAL GAS - COMMODITY
11/03/2026
Hey MomsWhoTrade family! 👋
Let’s get into the charts for NATURAL GAS! Looking at the 4-hour chart, it’s a very different vibe from the other assets we’ve been tracking. While everything else is jumping around, Gas is following a very specific script.
The Big Picture (Current Price Action)
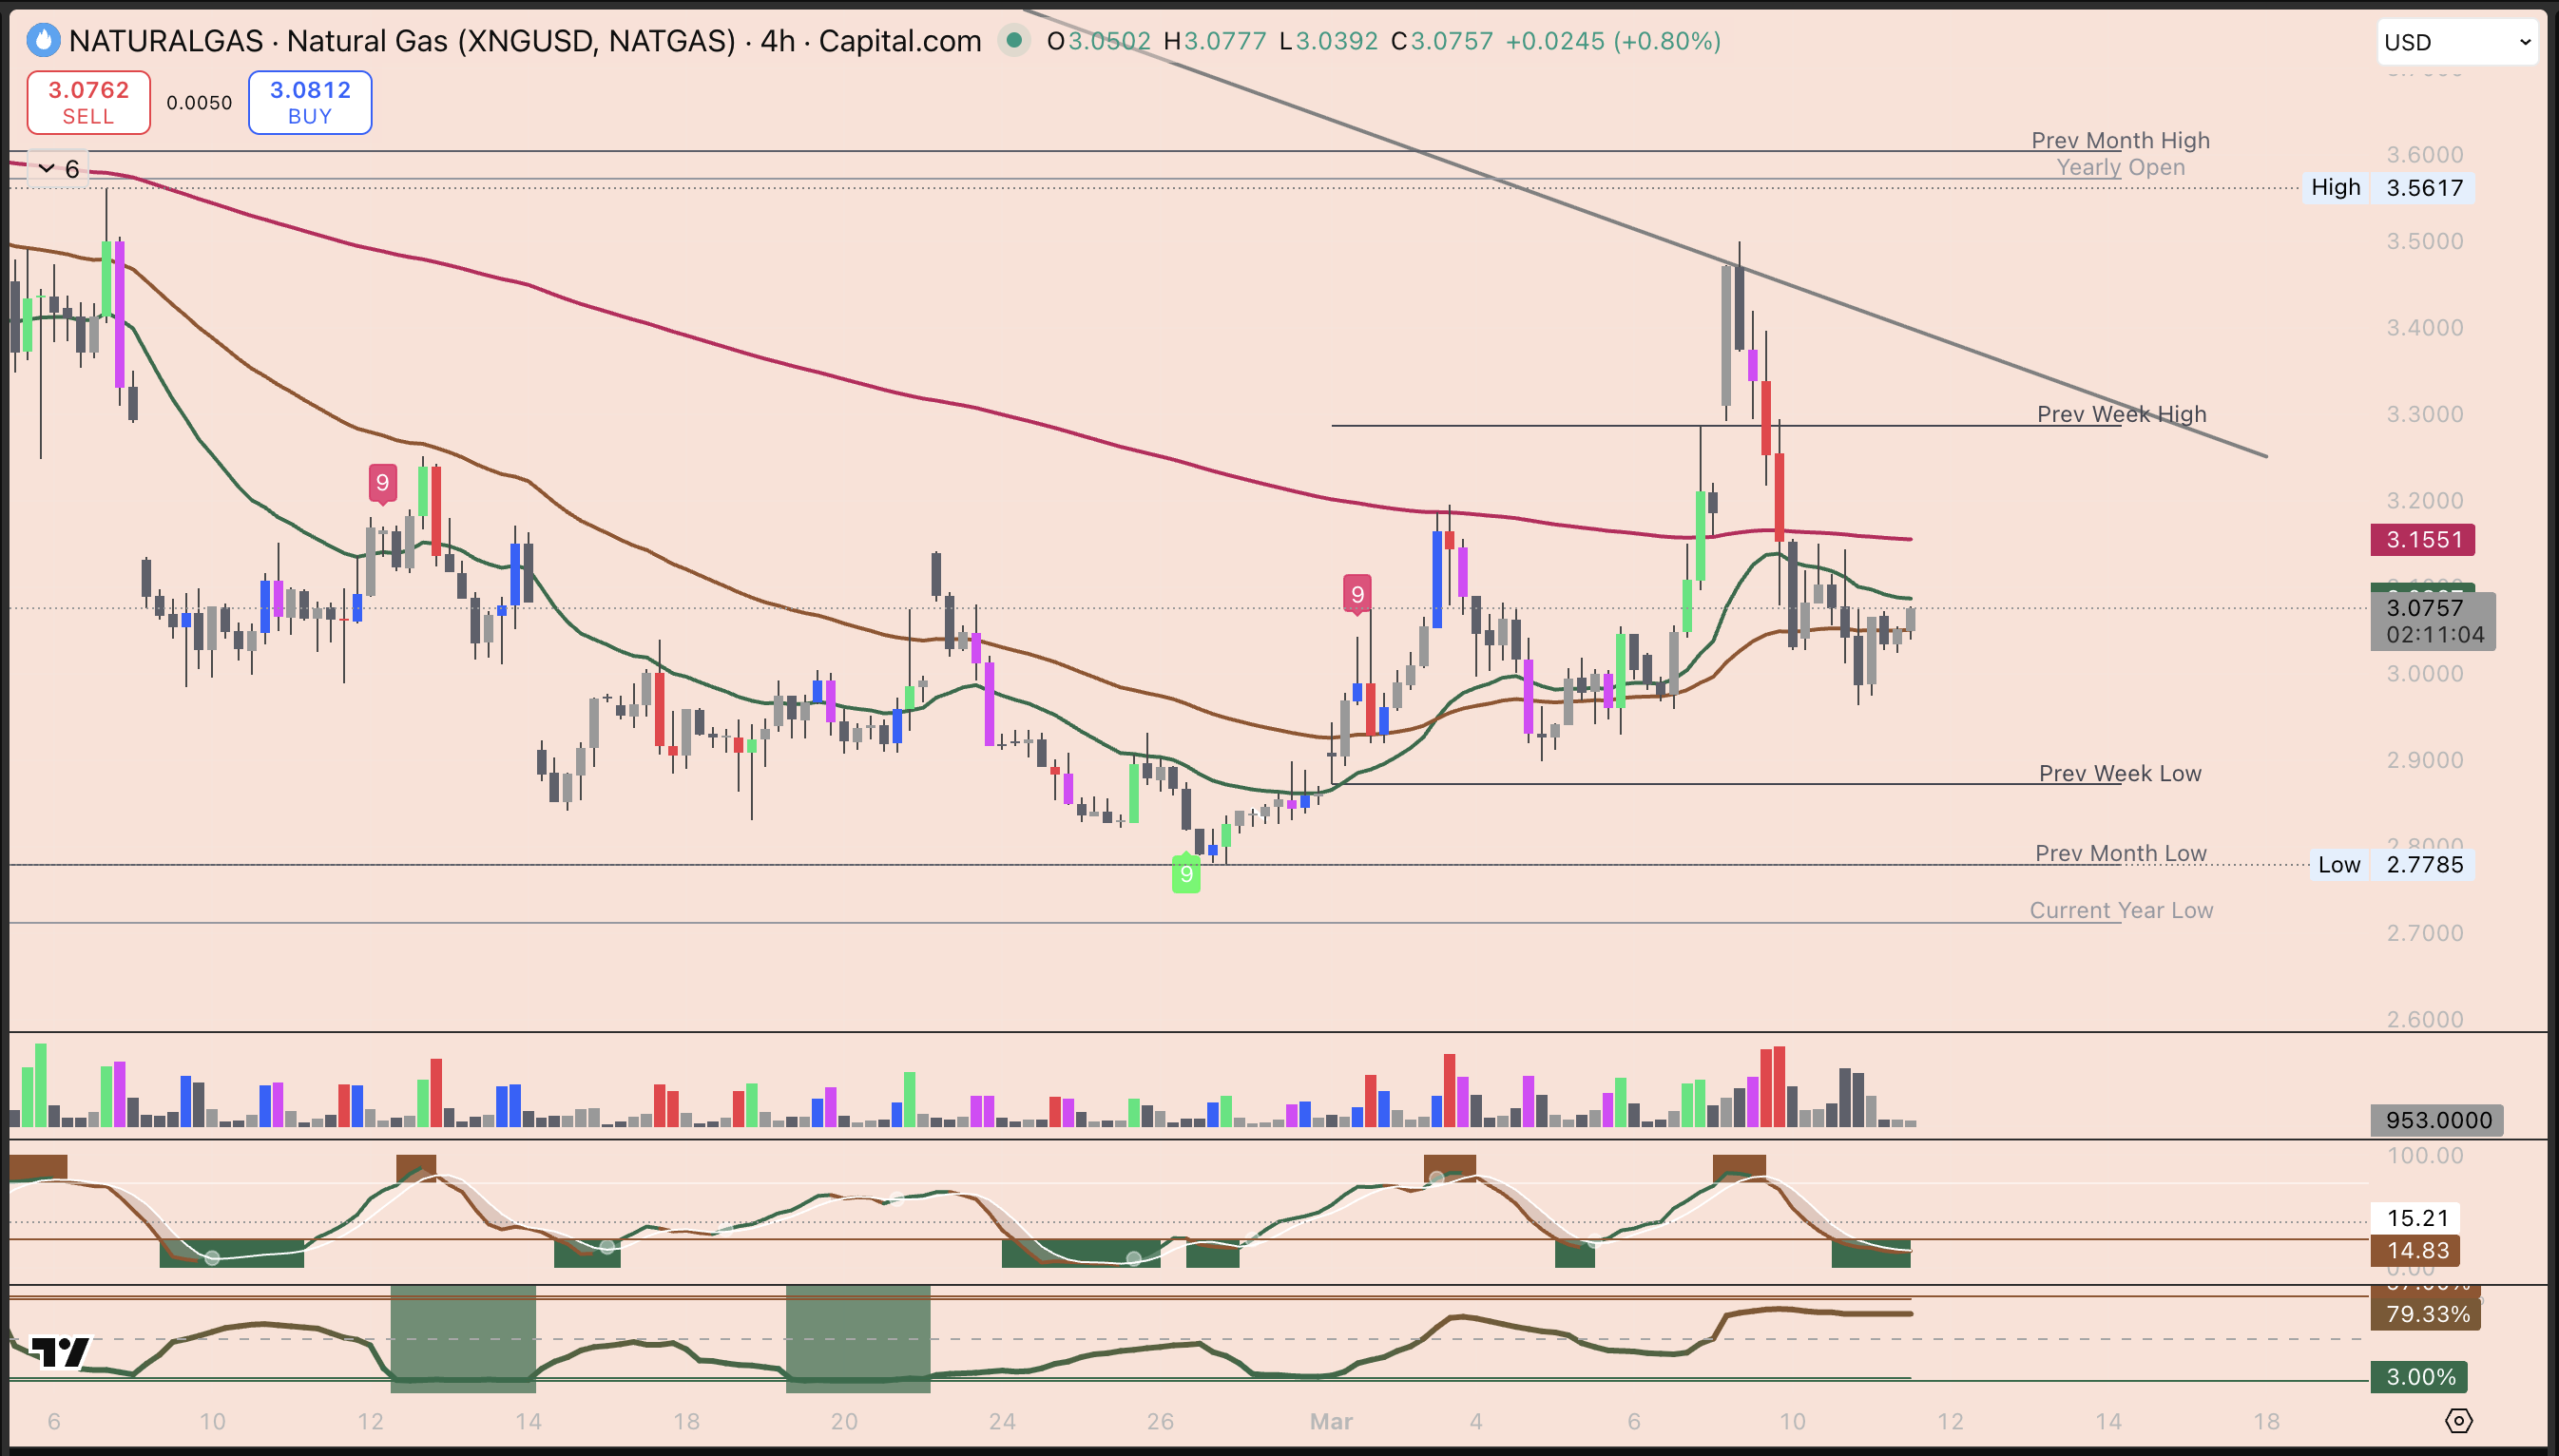
Natural Gas is currently in a "structural decline" on the 4-hour time frame. While Oil and HYPE have been climbing, Gas has been sliding down a very clear staircase.
As of today, it is trading around $3.03 - $3.05. It has decoupled from the "War Trade" we see in Oil because US domestic supply is at record highs. On the chart, you can see it's struggling to find its footing as it approaches a major psychological crossroads.
The "Vibe Check"
The market is currently feeling "Over-Supplied."
- The Weather Factor: Unseasonably warm forecasts for late March are killing the demand for heating. Without a "Cold Snap," there isn't much reason for buyers to rush in.
- The Domestic Bubble: Even though global prices are high, the US is producing so much gas that we literally have nowhere else to send it, keeping our local prices suppressed.
- The Indicator Warning: Technical indicators like the RSI are flashing a "Strong Sell" signal right now. The momentum is firmly with the bears.
Key Levels (The Floors and Ceilings)
On your 4-hour chart, here are the major boundaries we are watching:
- Major Resistance (The Ceiling): $3.45. This is the level we need to break to prove the bulls are back. Until we close a 4-hour candle above this, every "pop" is likely just a selling opportunity.
- Critical Support (The Floor): $3.00. This is the "must-hold" psychological floor. If the price slips below $3.00, it could trigger a fast slide as stop-losses get hit.
- The "Deep" Safety Net: If $3.00 fails, we are looking all the way down at $2.75 as the next spot where the "bargain hunters" might show up.
Prediction & Thoughts
Expect Natural Gas to stay heavy in the short term. Without a major change in the weather or a sudden drop in production, the path of least resistance is sideways-to-down. As long as it stays below the $3.45 ceiling, the trend remains bearish. We want to see a "Double Bottom" or a strong bounce at $3.00 before we even consider this for a long-term play.
Mom Tip: In this environment, "patience" is your best asset. Don't feel the need to catch the "falling knife." Let the market prove it has found a bottom at the $3.00 floor before putting your capital at risk!