GOLD - COMMODITY
16/03/2026
Gold has been all over the news lately — and for good reason. After hitting record highs, it just had one of its biggest drops in months. So the question everyone's asking is: Is this a buying opportunity?
The Big Picture (Current Price Action)
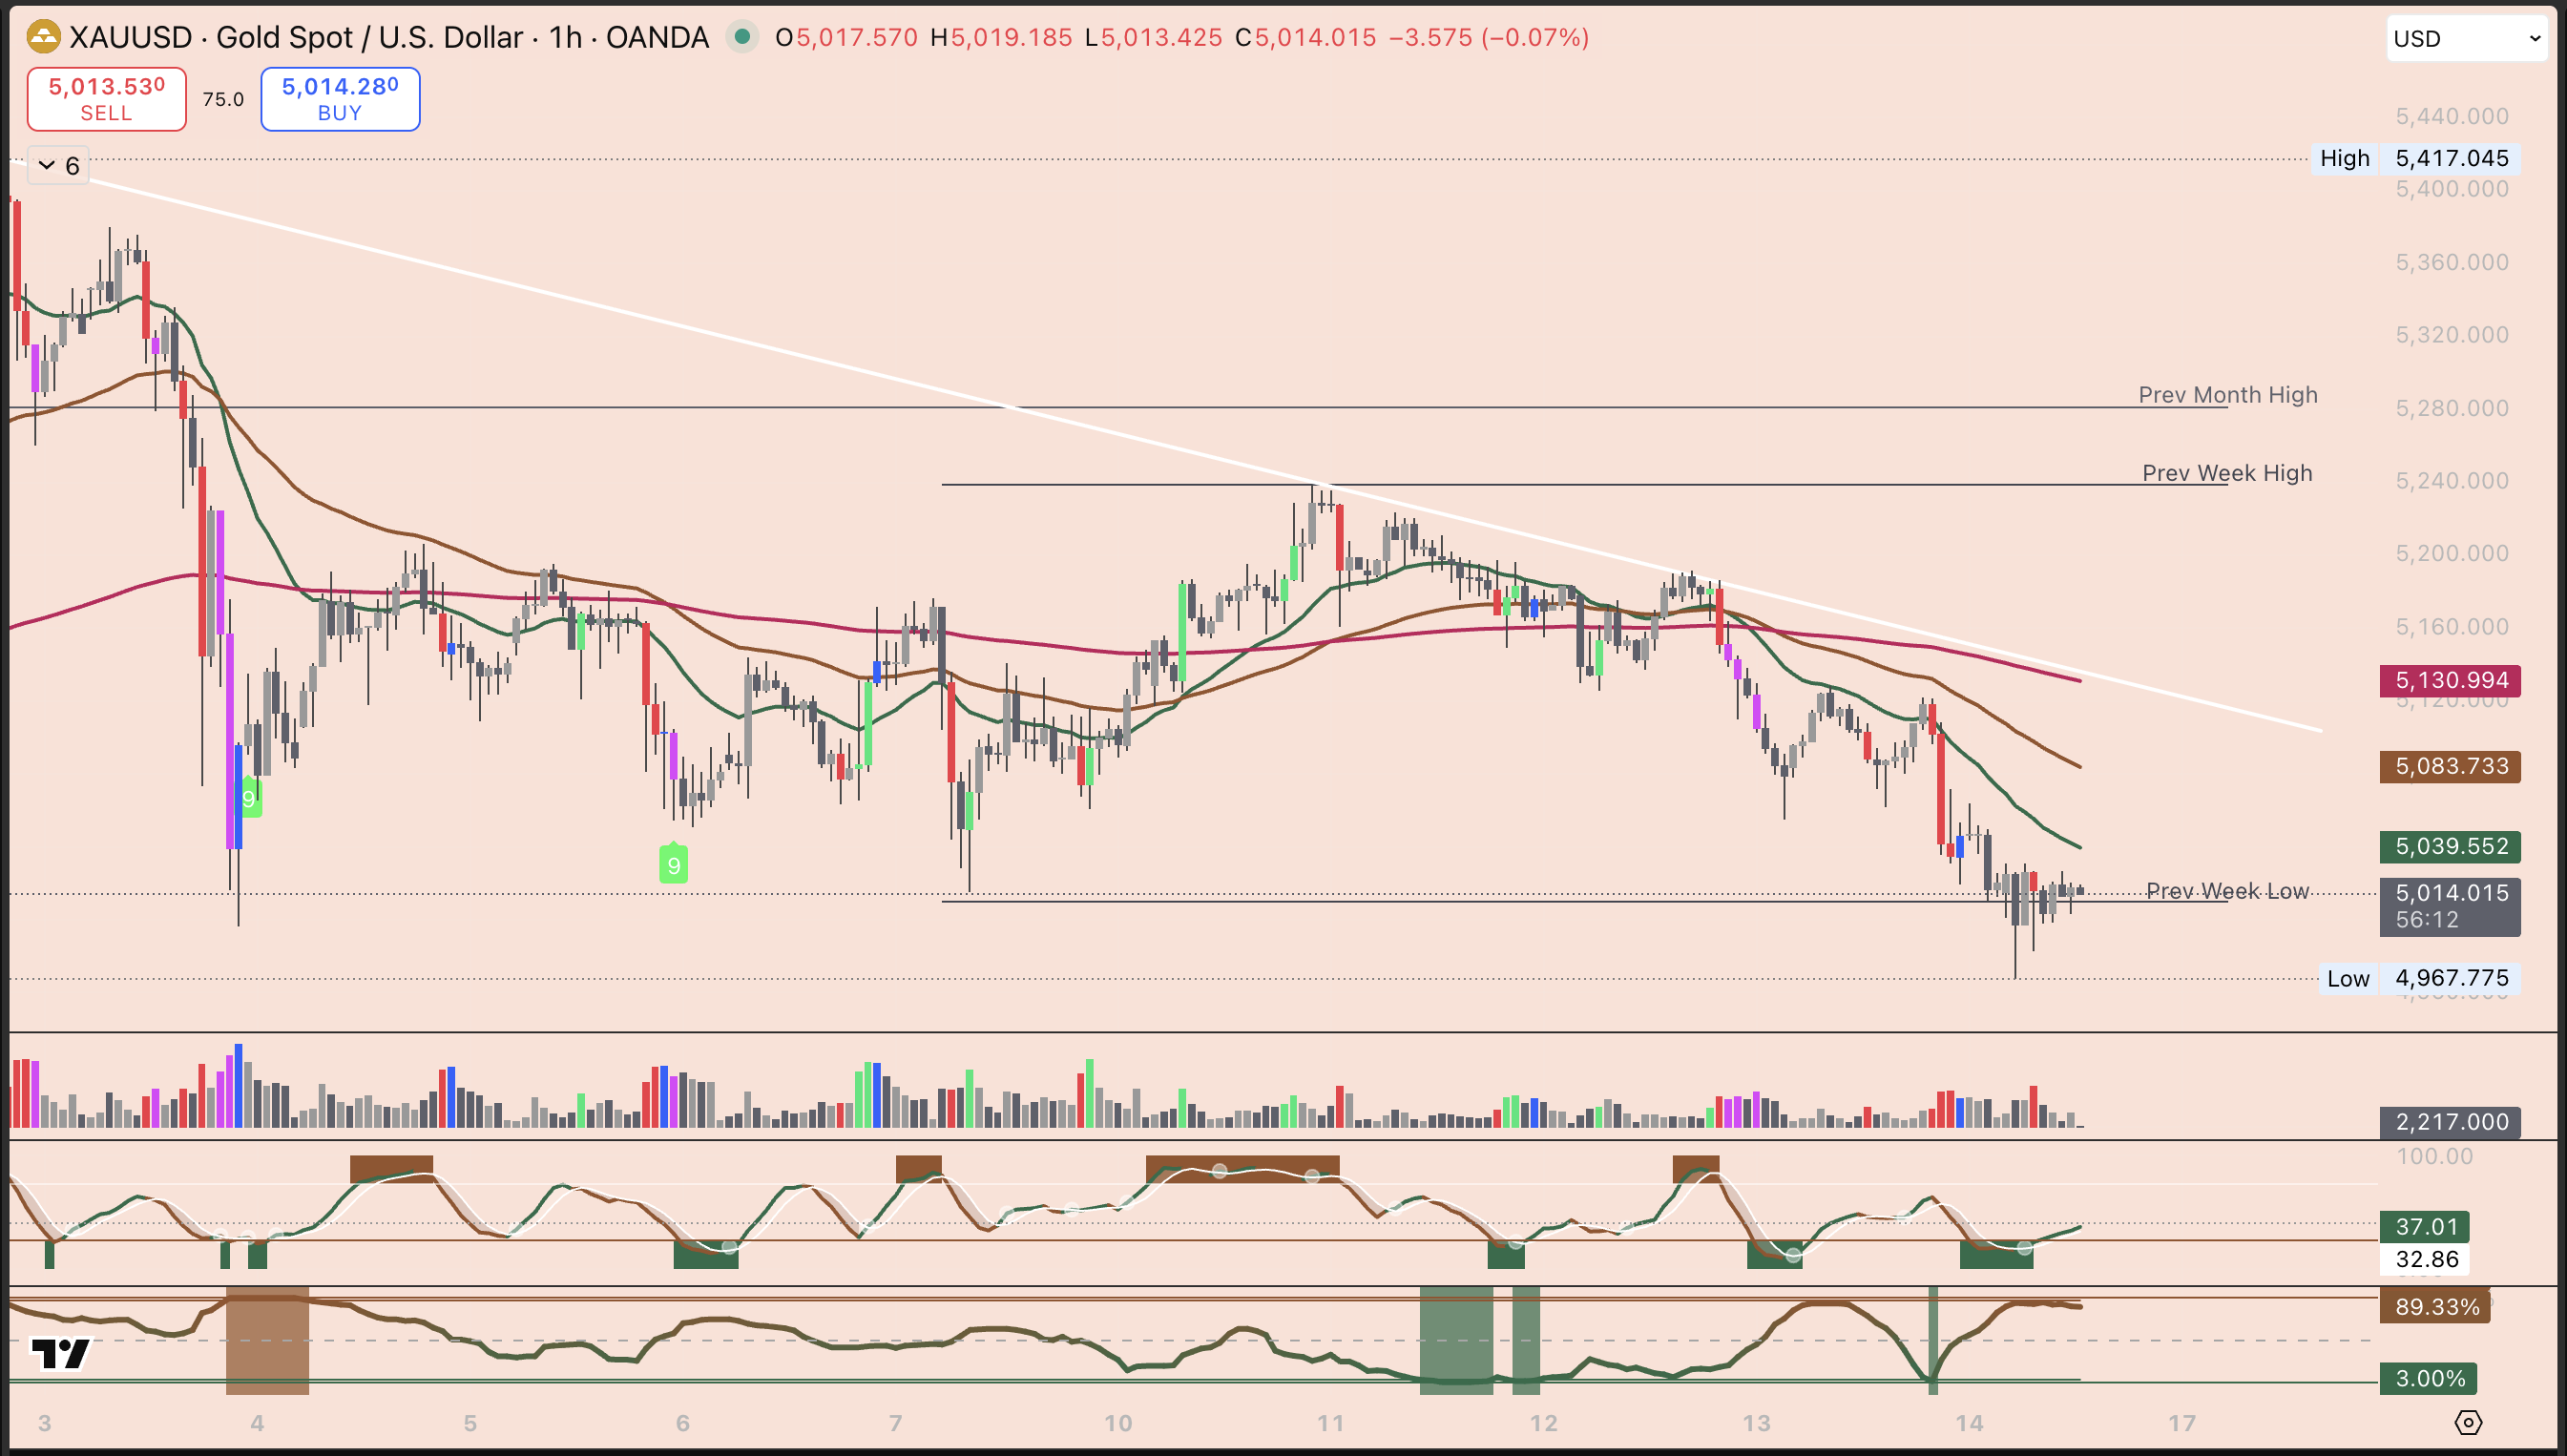
Gold ran up hard and fast over the past few months. Then last week - it fell, a big, fast, sharp drop.
Right now, it's trying to bounce back, but the bounce feels shaky. Think of it like someone who just ran a full sprint — they're not ready to go again yet. They need to catch their breath first.
That's Gold right now. Catching its breath.
Key Levels (The Floors and Ceilings)
The $5,000 mark is the number everyone is watching. It's a big round number - and in trading, big round numbers matter because everyone's eyes are on them.
If Gold can hold above $5,000 and stabilise, a recovery is possible. If it drops through it, there's more room to fall before it finds real support.
Above us, there's a resistance zone in the $5,180 - $5,250 range - that's the first real ceiling price we would need to push through to start looking healthy again.
The "Vibe Check"
The market is feeling unsettled but not broken.
Gold's fundamentals - the reasons people buy it in the first place (uncertainty, inflation, global tension) - haven't gone away. But after such a big run-up, some profit-taking was inevitable. People who made a lot of money decided to cash out. That selling pressure is what caused the drop.
Is This Worth Watching?
Yes - but not for rushing in.
The chart needs to calm down. Right now, it's too choppy and unpredictable. What we want to see over the next day or two is Gold sitting quietly around $5,000, with smaller, calmer candles. That would tell us the selling has stopped and buyers are starting to take control.
That's the setup we'd want to see before this becomes interesting.
💡 Mom Tip: "Cheap" doesn't mean "ready to buy." Gold dropped a lot, but dropping a lot and being a good entry point are two different things. Wait for the chart to settle and show you that buyers are back. Don't jump in just because the price is lower than it was. Let the market prove it's done falling first.
27/02/2026
Gold has been the "ultimate safe haven" lately, but even the king of metals needs a breather. Let’s break down this chart with the latest global vibes and some fresh numbers.
The Big Picture (Current Price Action)
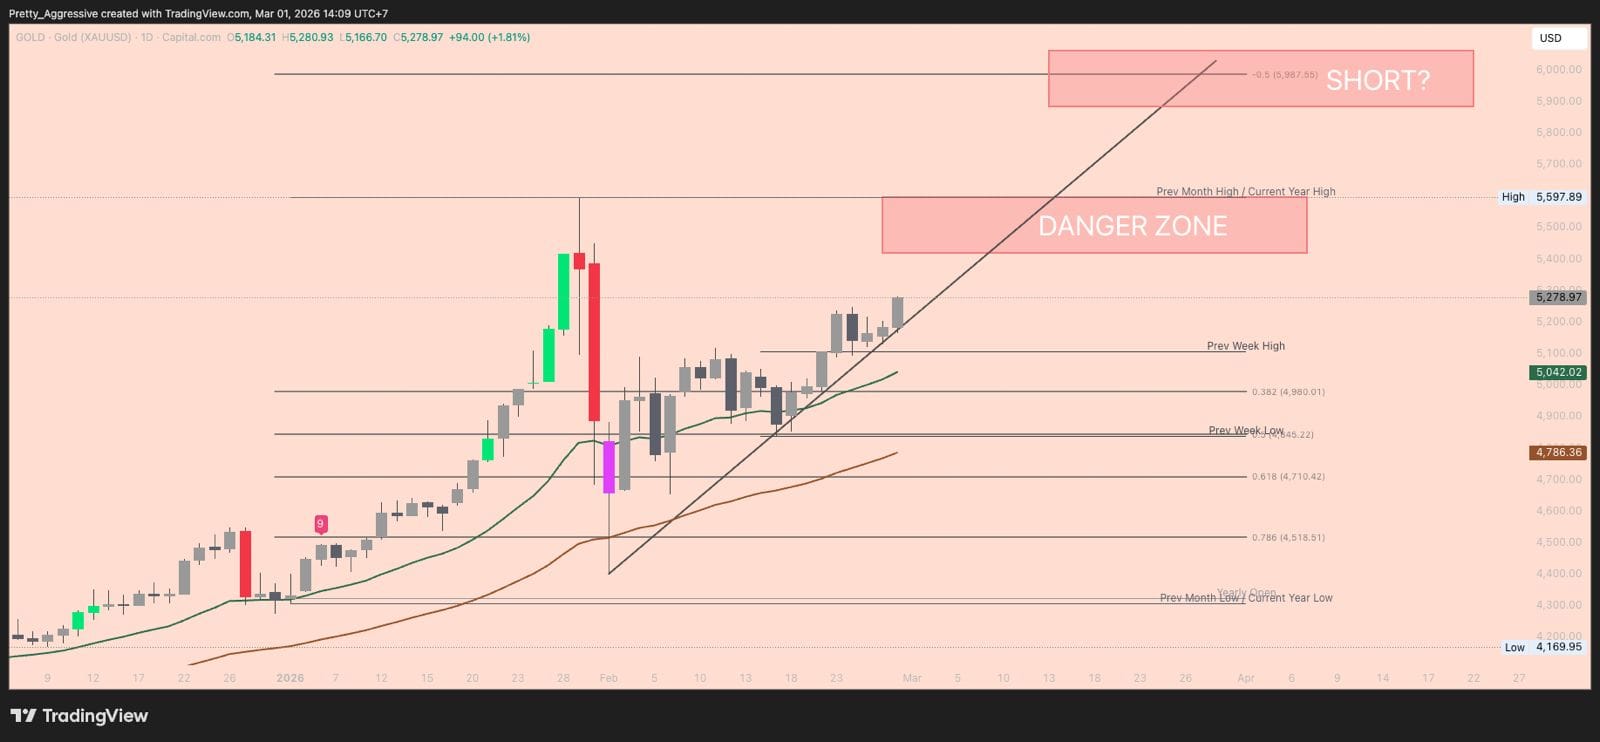
Gold is currently in a "corrective rebound" phase. After a massive waterfall drop from all-time highs earlier this month, the price is trying to crawl back up.
Right now, gold is trading around $5,177 – $5,180. It’s a bit of a "wait-and-see" Friday as traders digest a lot of mixed signals from the U.S. and overseas.
Key Levels (The Floors and Ceilings)
On your 4-hour chart, you'll see the price is wedged between some very clear boundaries:
- Critical Support (The Floor): $5,046. This is our "must-hold" level. As long as the price stays above this, the recovery is still on the table. If we break below it, we might see a slide toward $4,960.
- Major Resistance (The Ceiling): $5,200 – $5,250. This is the immediate "stop sign" where the sellers are hanging out. Gold actually hit $5,250 earlier this week, but got pushed back down.
- The Big Dream Target: If we can blast through $5,250, the next stop for the "gold train" is up near $5,307 – $5,448.
Technical & Global Vibe Check
- The "Trump Trade": President Trump’s recent State of the Union address initially sent gold surging because of uncertainty over new 15% global tariffs. However, today the price is cooling off because the market is starting to "price in" these changes.
- Middle East Tensions: There are ongoing nuclear talks between the U.S. and Iran in Geneva. If these talks go well, gold might drop (less fear). If they stall, gold could head toward $5,500.
- The Dollar Factor: The U.S. Dollar Index (DXY) is creeping up slightly to 97.78, which acts like a "weight" on gold prices.
RSI: The Speedometer (Relative Strength Index)
The RSI is a little line that lives at the bottom of your chart. It tells you how fast a stock is running and if it’s starting to get "tired." It moves between 0 and 100.
Current Vibe: Right now, Bitcoin's weekly RSI is at a historic low of 25.6—it's never been this "exhausted" before! For Tesla, the RSI is hovering around 45, which is like driving the speed limit—not too fast, not too slow.
Volatility: The Weather Report
Volatility is simply how much a price "swings" up and down.
Current Vibe: Volatility is very high right now! Between the $7.8 billion in Bitcoin options expiring today and the news coming out of the US about EV policies and global tariffs, the "market weather" is definitely stormy.
When we see High Volatility combined with an Oversold RSI, that is often our "Gold Mine" signal.
- High Volatility creates a big, fast drop.
- Oversold RSI (under 30) tells us the drop is likely overextended.
- The Result: We wait for that "Higher-Low" we talked about earlier to confirm the bounce, and then we enter with a plan!
💡 Mom Tip: In a stormy market (high volatility), RSI can stay "Oversold" longer than you think. Just because the speedometer says we're going slow doesn't mean we can't go even slower.
Always wait for the price to actually start moving back up before jumping in! Friday afternoons can be "profit-taking" time. If you don't see a clear bounce by 11:00 AM EST, it might be safer to keep your hands in your pockets and wait for the Sunday night market open!