GOLD - COMMODITY
27/02/2026
Gold has been the "ultimate safe haven" lately, but even the king of metals needs a breather. Let’s break down this chart with the latest global vibes and some fresh numbers.
The Big Picture (Current Price Action)
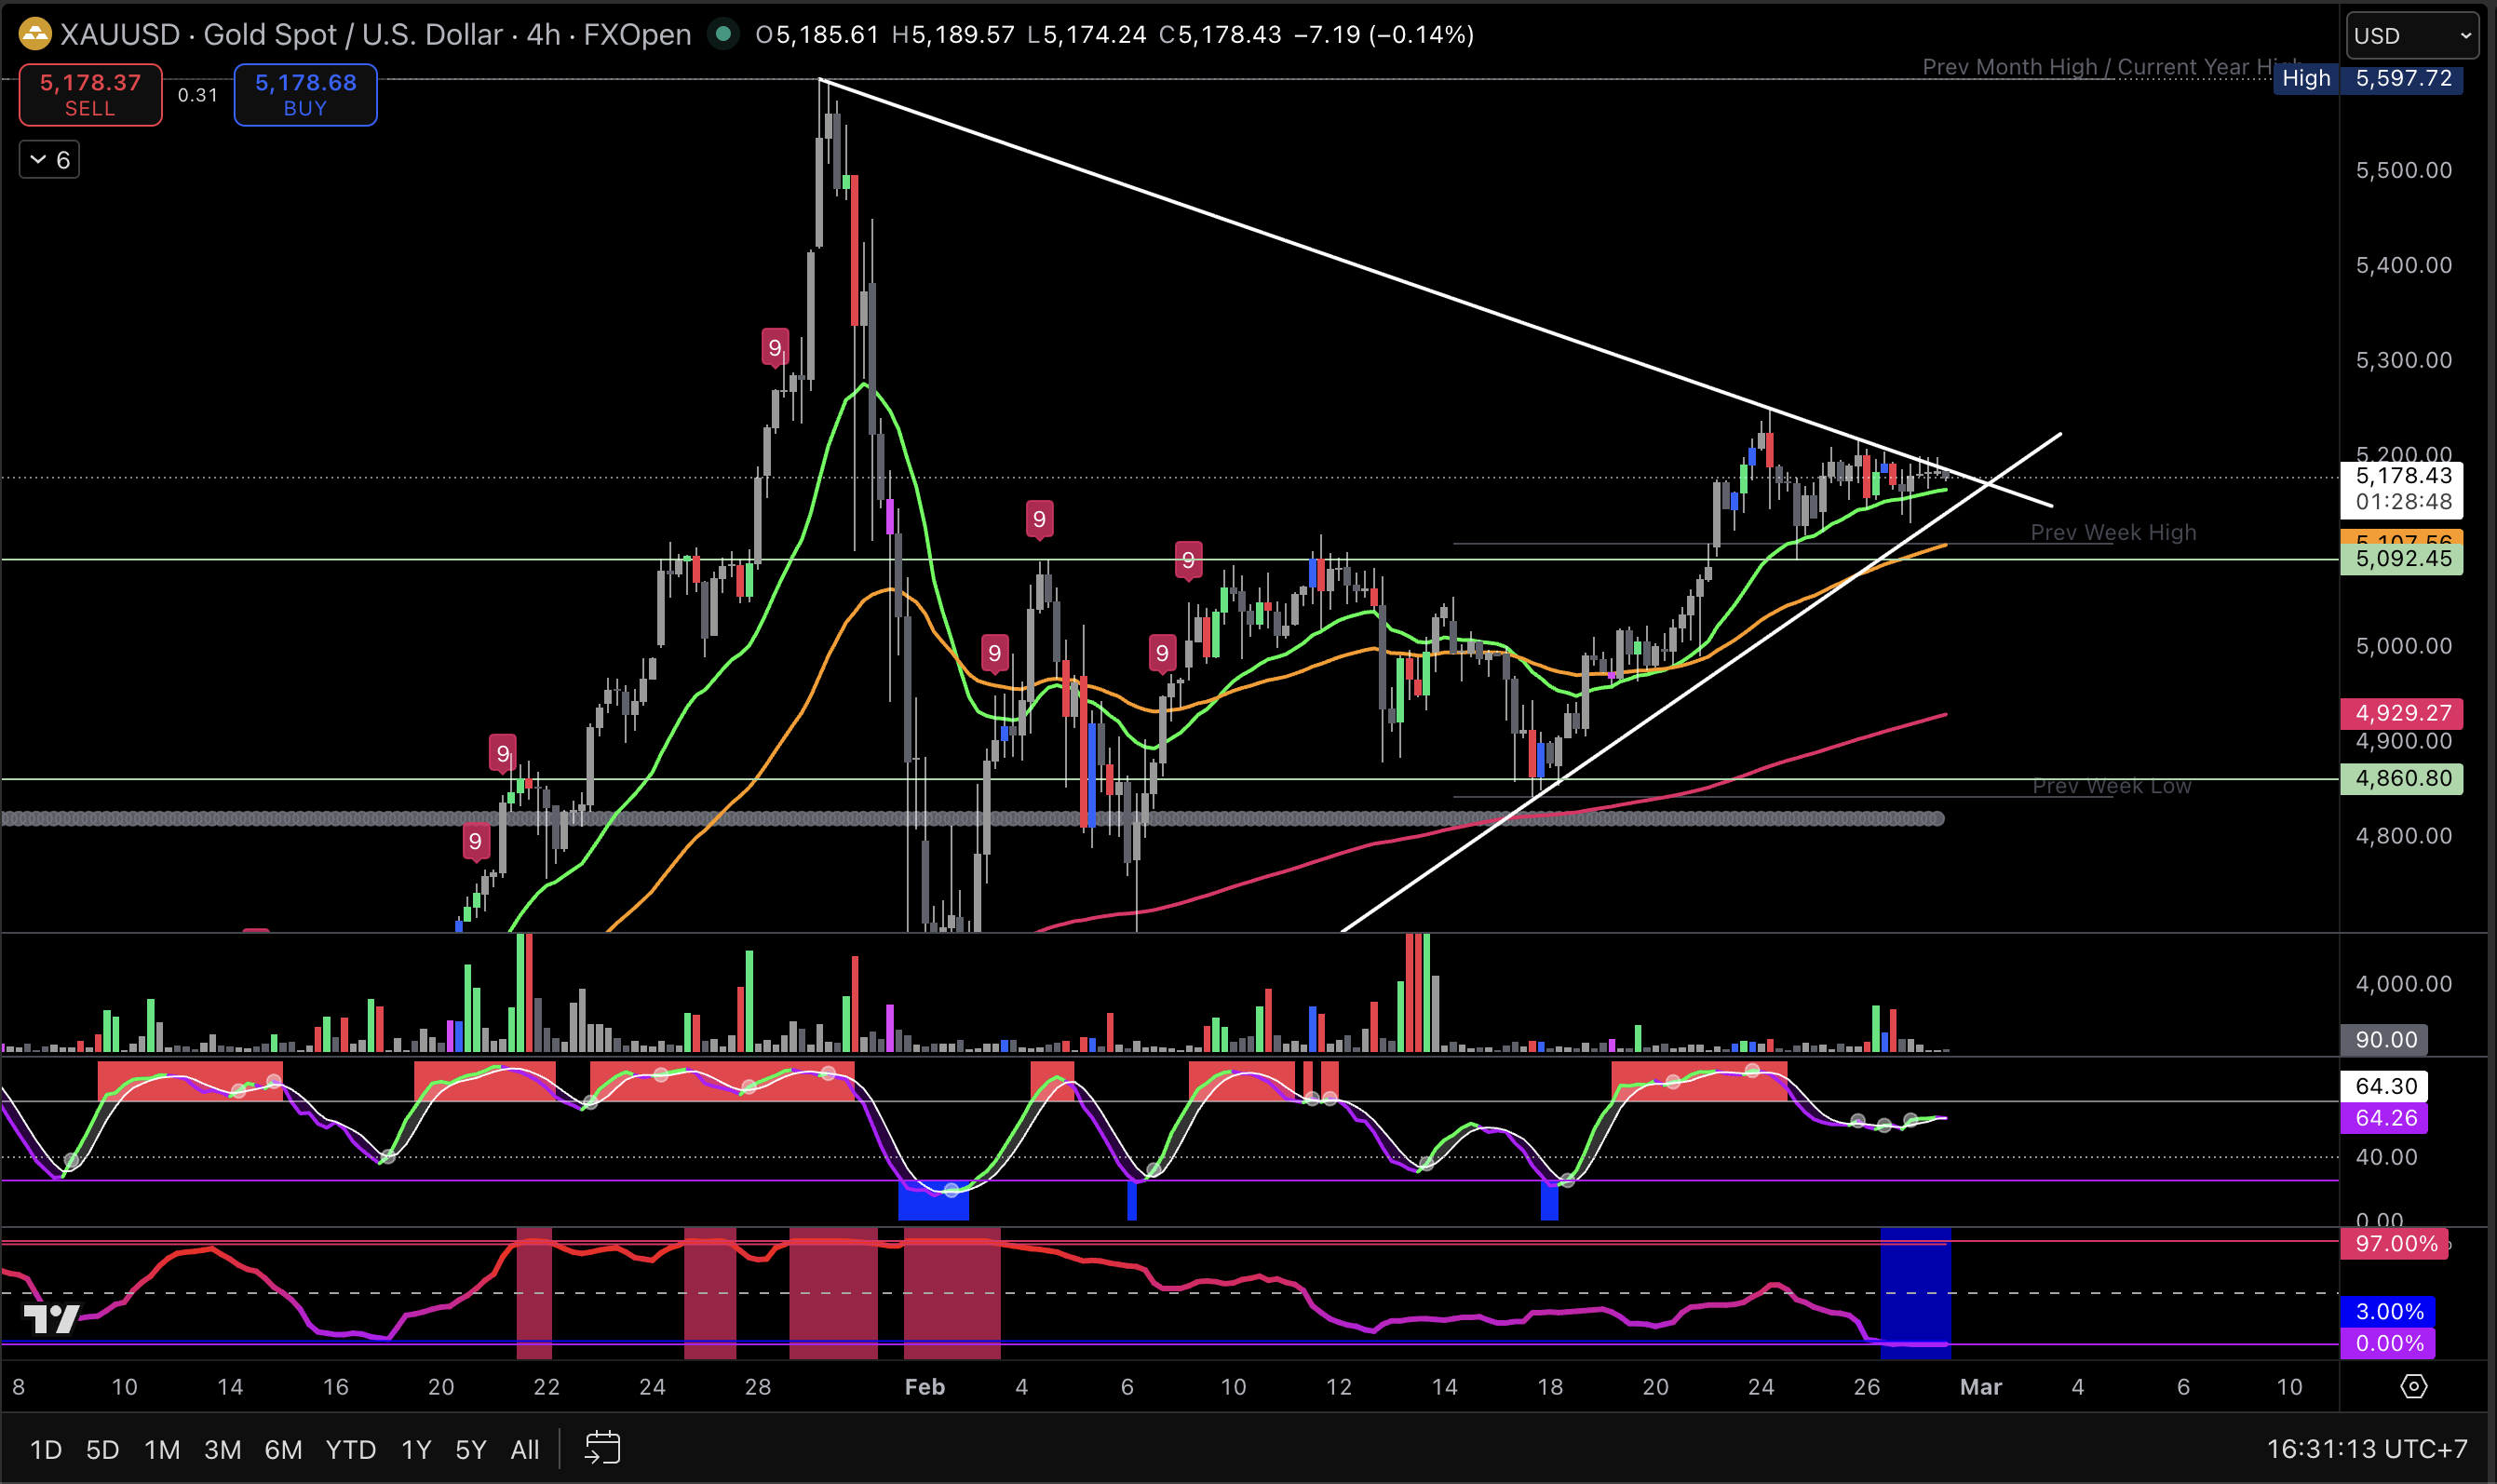
Gold is currently in a "corrective rebound" phase. After a massive waterfall drop from all-time highs earlier this month, the price is trying to crawl back up.
Right now, gold is trading around $5,177 – $5,180. It’s a bit of a "wait-and-see" Friday as traders digest a lot of mixed signals from the U.S. and overseas.
Key Levels (The Floors and Ceilings)
On your 4-hour chart, you'll see the price is wedged between some very clear boundaries:
- Critical Support (The Floor): $5,046. This is our "must-hold" level. As long as the price stays above this, the recovery is still on the table. If we break below it, we might see a slide toward $4,960.
- Major Resistance (The Ceiling): $5,200 – $5,250. This is the immediate "stop sign" where the sellers are hanging out. Gold actually hit $5,250 earlier this week, but got pushed back down.
- The Big Dream Target: If we can blast through $5,250, the next stop for the "gold train" is up near $5,307 – $5,448.
Technical & Global Vibe Check
- The "Trump Trade": President Trump’s recent State of the Union address initially sent gold surging because of uncertainty over new 15% global tariffs. However, today the price is cooling off because the market is starting to "price in" these changes.
- Middle East Tensions: There are ongoing nuclear talks between the U.S. and Iran in Geneva. If these talks go well, gold might drop (less fear). If they stall, gold could head toward $5,500.
- The Dollar Factor: The U.S. Dollar Index (DXY) is creeping up slightly to 97.78, which acts like a "weight" on gold prices.
Potential Trade Opportunity
Since you're looking for an entry on the lower time frames, here is the "Mom's Game Plan":
The "Buy the Dip" Setup: Look for a Higher-Low to form near the $5,130 – $5,150 zone. If the US market opens and gold dips to this area but "bounces" with strong volume, it could be a great entry for a ride back up to $5,200.
RSI: The Speedometer (Relative Strength Index)
The RSI is a little line that lives at the bottom of your chart. It tells you how fast a stock is running and if it’s starting to get "tired." It moves between 0 and 100.
Current Vibe: Right now, Bitcoin's weekly RSI is at a historic low of 25.6—it's never been this "exhausted" before! For Tesla, the RSI is hovering around 45, which is like driving the speed limit—not too fast, not too slow.
Volatility: The Weather Report
Volatility is simply how much a price "swings" up and down.
Current Vibe: Volatility is very high right now! Between the $7.8 billion in Bitcoin options expiring today and the news coming out of the US about EV policies and global tariffs, the "market weather" is definitely stormy.
When we see High Volatility combined with an Oversold RSI, that is often our "Gold Mine" signal.
- High Volatility creates a big, fast drop.
- Oversold RSI (under 30) tells us the drop is likely overextended.
- The Result: We wait for that "Higher-Low" we talked about earlier to confirm the bounce, and then we enter with a plan!
💡 Mom Tip: In a stormy market (high volatility), RSI can stay "Oversold" longer than you think. Just because the speedometer says we're going slow doesn't mean we can't go even slower.
Always wait for the price to actually start moving back up before jumping in! Friday afternoons can be "profit-taking" time. If you don't see a clear bounce by 11:00 AM EST, it might be safer to keep your hands in your pockets and wait for the Sunday night market open!