BITCOIN - US - Crypto

02/09/2025
An Updated Look at the Bitcoin Chart!
Hey mamas! Let's take a closer look at that Bitcoin chart and see what all the little signals are telling us.
1. The Trend (The Ladder We Were Climbing) The long, grey upward line was the main path BTC was taking—our ladder. In late August, Bitcoin broke the trend, and the price went down. This ended that nice, steady climb we were on. The good news? It looks like it's trying to build a new staircase up from its recent low.
2. The Moving Average (The Big Green Safety Net) That thick green "river" on the chart is our moving average. Think of it as a huge, comfy cushion. When the price fell, it landed perfectly on this cushion and bounced right back up. This is a super strong sign that even though we fell off the ladder, there was a big safety net waiting to catch the price around $107,500.
3. The Fibonacci Levels (Our Price Roadmap) Those horizontal lines with numbers like 0.5 and 0.618 are our Fibonacci levels. They act as a roadmap for where the price might go or stop. BTC fell right through the level at $111,704 and landed almost exactly at the 0.5 level (around $98,924) in June, before bouncing. This shows the roadmap is working! Now, it needs to reclaim that $111,704 level to prove it has strength.
4. The Volume (The Crowd Noise) Look at the bars at the bottom. Notice that huge red bar when the price dropped? That was a lot of "panic selling"—a loud noise of people rushing for the exit. But then, look at the green bars that followed. We're seeing some hopeful "buying" volume come in, supporting this bounce. We want to see this green volume continue to grow as the price climbs.
5. The RSI / Oscillator (The Secret Energy) This is my favorite part! Look at the very bottom indicator. While the price made a lower low during the drop, the indicator made a higher low (that green line). This is a bullish divergence. It’s our secret clue that even though the price looked weak, the underlying momentum was actually getting stronger. It’s like when your kid gets really quiet, and you know a burst of energy is coming. That's exactly what happened with this bounce!
Simple Summary:
Bitcoin broke its long-term ladder (trend), fell down to a key roadmap level (Fibonacci), but was caught by a strong safety net (moving average). The loud panic selling (volume) seems to be quieting down, and a secret burst of energy (RSI divergence) helped kick off this bounce.
Now, we're watching to see if it can gather enough strength to climb back above $111,700.
Hope this deeper dive helps, mamas! 💚

19/08/2025
Name of asset: BITCOIN - US
Asset Category: Crypto
Time frame: Daily
Hey amazing MomsWhoTrade Community,
Today, we're diving into the king of crypto, Bitcoin (BTC). The daily chart shows a classic battle between buyers and sellers after a powerful rally, providing us with clear levels to watch for potential future moves.
Let's also keep in mind that this week has some economic events that could also impact the market:
- Wednesday: FMCO Meeting Minutes. This is a report from the Federal Reserve's July meeting, where they talk about interest rates and inflation. Think of it like a peek into their plans for the economy. If they sound "hawkish" (wanting higher rates to fight inflation), the U.S. dollar might get stronger, which can push crypto prices down. If they sound "dovish" (favoring lower rates to help growth), it could boost crypto prices. It’s a big deal for trading, so prices might move a lot when it’s released!
- Thursday: Jackson Hole Economic Symposium. This year's theme is "Labor Markets in Transition: It’s a big meeting where economic leaders talk about jobs, workers, and how the economy is doing, with a focus this year on changes in the job market. People watch it closely because it might hint at lowering interest rates (which can help crypto prices). If they sound "dovish" (meaning they want to boost the economy with lower rates), it could make Bitcoin prices swing up or down.
- Friday: Flash Services & Manufacturing PMI. These reports are like a sneak peek into the health of the services and manufacturing sectors. Stronger-than-expected numbers can boost market confidence, while weaker numbers could suggest an economic slowdown is on the horizon.
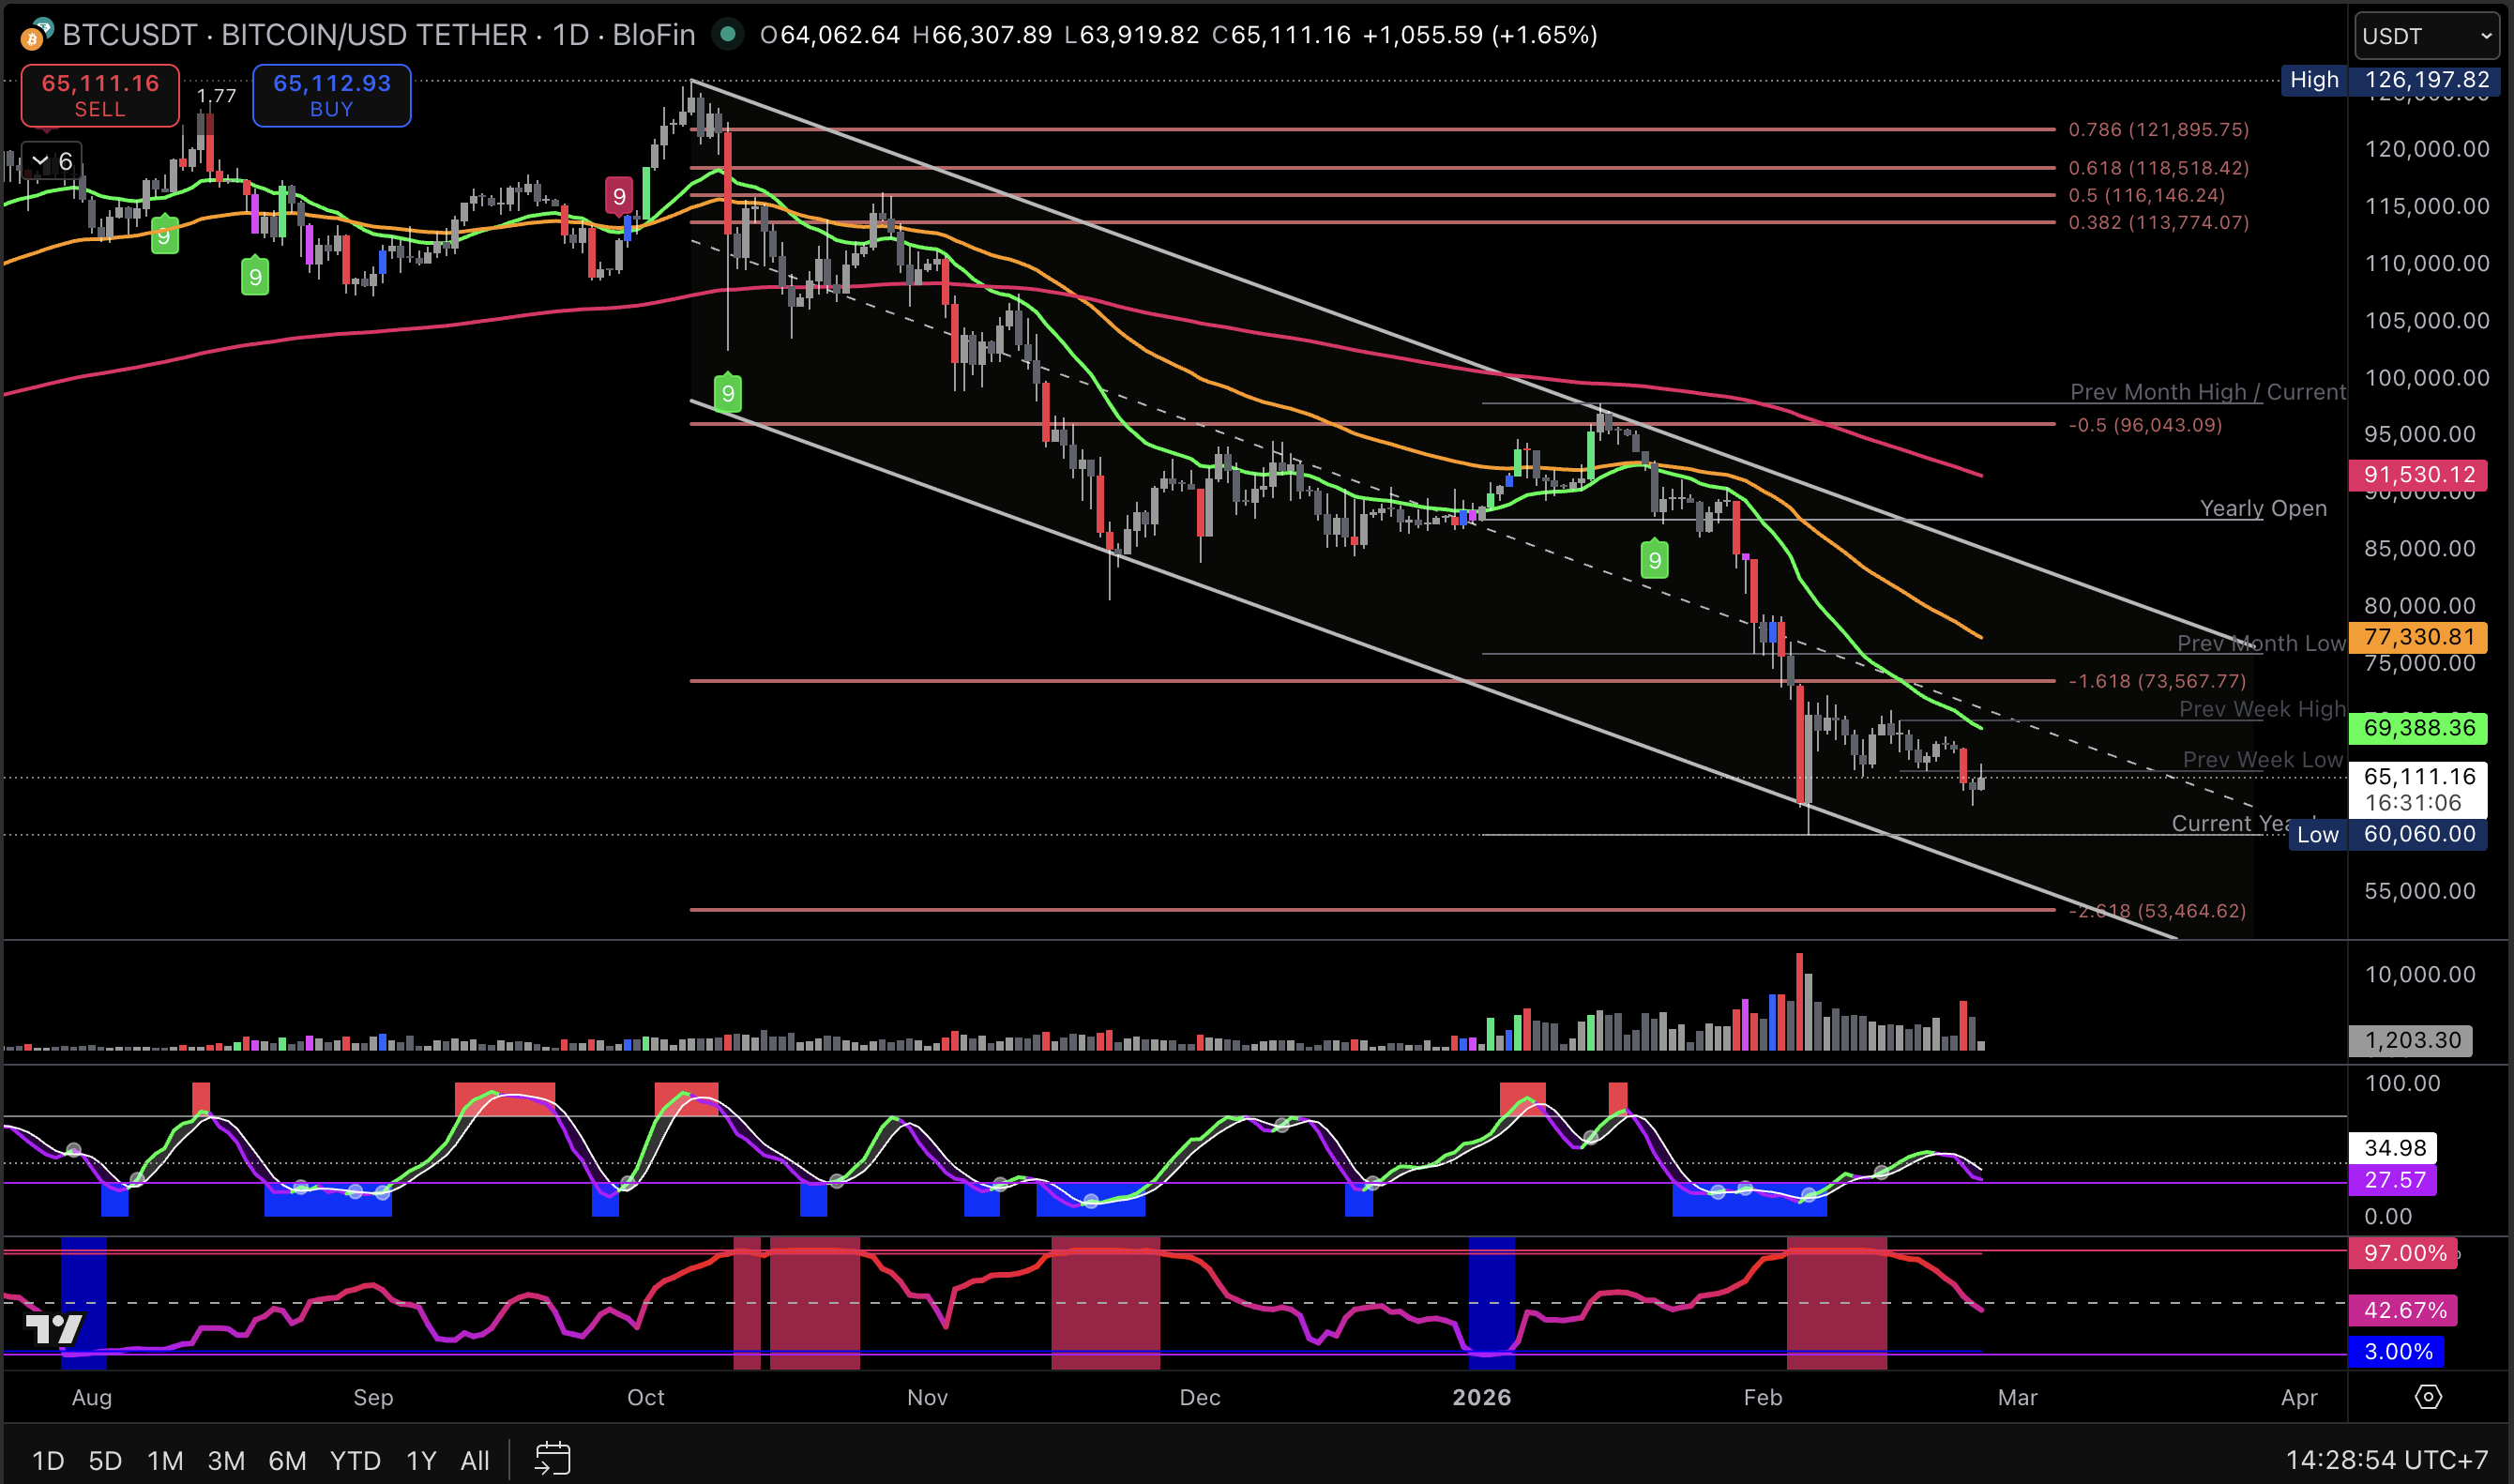
The Big Picture (Current Price Action):
After an incredible run-up that peaked around $124,000 in late July and again in mid-August, Bitcoin is currently experiencing a pullback. This "double top" pattern (hitting a high price twice without breaking through) is a sign of strong resistance, and the price is now correcting downwards. We are currently trading at approximately $115,038.
Key Levels (Where the Action Is):
The chart has beautifully defined support and resistance zones that act like floors and ceilings for the price.
- Critical Support / Floor: The most important level to watch right now is at $111,704. The price has bounced strongly from this area several times in the past month. How the price reacts here will be a major clue for the next direction.
- Major Resistance / Ceiling: The $124,000 level represents a significant hurdle. Bitcoin needs to break and hold above this price to confirm a continuation of its upward trend.
- Next Safety Net: If the $111,704 support fails, the next major support zone is between $101,000 and $106,300. This area is significant because it lines up with a previous support level, the green moving average line, and the 0.382 Fibonacci level.
Momentum Check (The Bottom Indicator):
Look at the oscillator at the bottom of the chart. After spending time in the upper "overbought" territory, the lines have crossed and are now pointing sharply downwards. This indicates that buying momentum is fading and sellers are starting to take control in the short term, which explains the current price pullback.
Volume Speaks Volumes:
Notice the volume bars at the very bottom. While the rally had strong buying volume, the recent red candles (selling days) also show significant volume. This suggests there is real conviction behind this selling pressure, which could mean the pullback has more room to go before buyers step back in confidently.
What to Watch For:
The key takeaway here is the battle happening at the $111,704 support level. A strong bounce from this area could indicate that buyers are defending the price, and the uptrend may resume. However, a decisive break below this floor could signal a deeper correction, with the next major support zone around the low $100,000s.
Important Reminder: This is a technical analysis, not financial advice. Trading involves risk, and you could lose money. Always do your own research and understand the market dynamics before making any decisions.
Let's watch these levels and trade smart! 💪